Section 1 Penal Code Offences Committed by Juveniles
1 Juveniles cleared
Fig. 4-1-1-1 [1] shows the number of juveniles cleared for penal code offenses (including juvenile offenders under 14 guided by the police; hereinafter the same in this section, unless specified otherwise) and rate per population (rate per population of juveniles aged 10 or older) since 1946 (See Appendix 4-1). There were three peaks with the trend in number of juveniles cleared for penal code offenses: the first peak in 1951 at 166,433, the second in 1964 at 238,830, and the third in 1983 at 317,438. Following 1984 the number was on a decreasing trend until 1995. After going through some slight ups and downs it then continued to decrease every year from 2004 and was 132,594 (down 1.4% from the previous year) in 2009. The rate per population also continued to decline every year from 2004 through to 2009. The number of juveniles cleared in 2009 was at the same level as around 1955 while the rate per population was at the same level as the second peak seen in 1964.
Fig. 4-1-1-1 Number of juveniles cleared for penal code offenses / non-traffic penal code offenses and rate per population
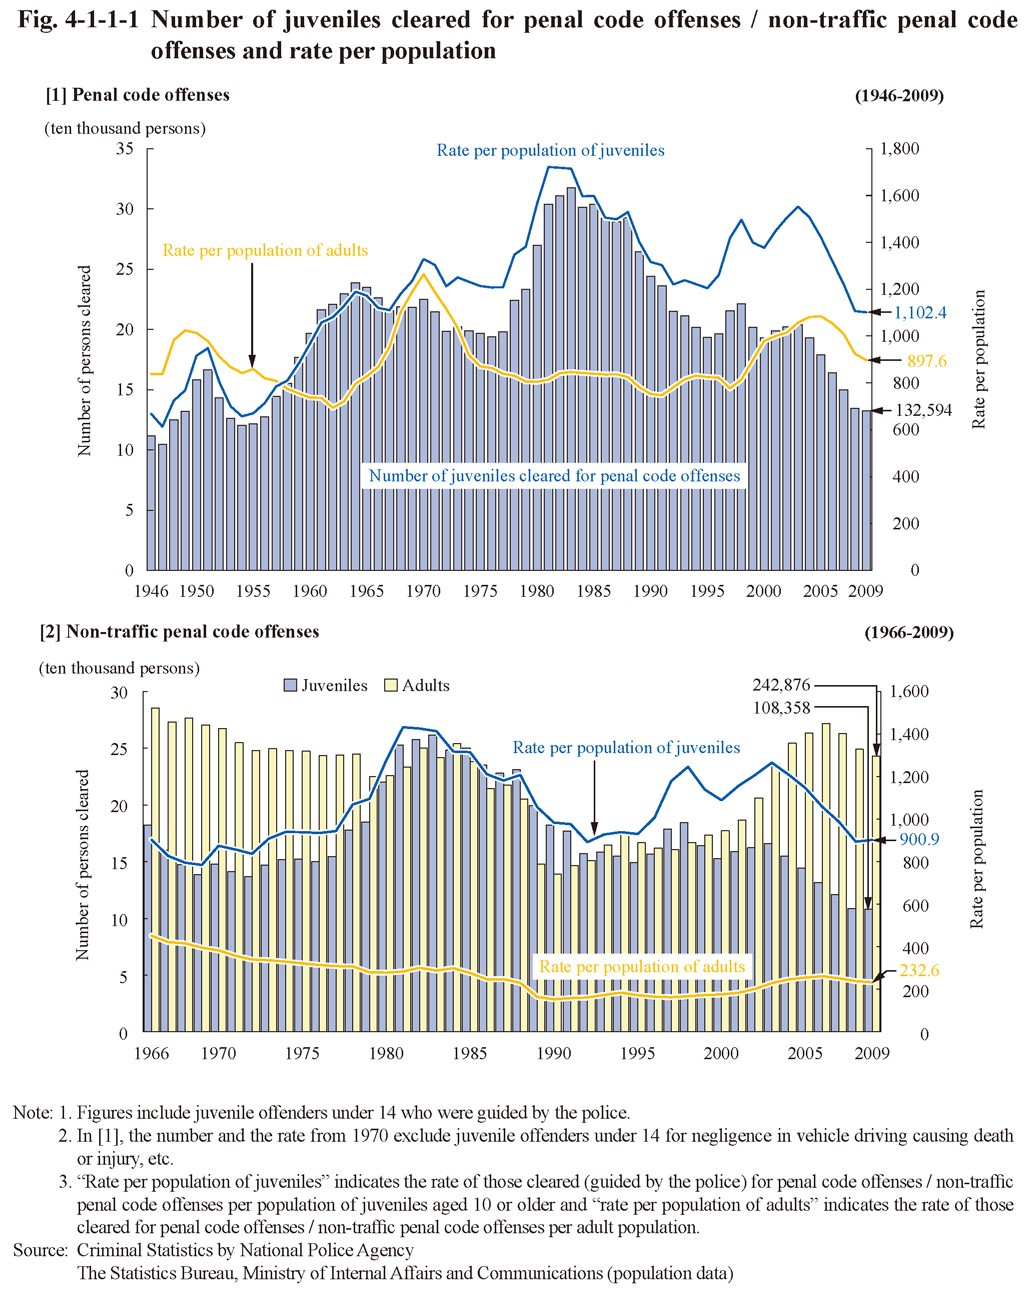
Fig. 4-1-1-1 [2] shows the number of juveniles and adults cleared for non-traffic penal code offenses and rate per population since 1966 (See Appendix 4-2). The number of juvenile offenders under 14 who were guided by the police for non-traffic penal code offenses has been on a decreasing trend after reaching three peaks in 1951, 1962, and 1981 (at 67,906). It remained within the range between 20 and 23 thousand on and after 1999 and fell below 20 thousand for the first time since 1950 in 2006. It was 18,029 in 2009 (up 2.6% from the previous year) (See Appendix 4-4).