Section 1 Trends in Offenses
Fig. 3-4-1-1 shows the number of persons cleared for non-traffic penal code offenses by age group over the last 20 years. Unlike the other age groups the number of elderly persons cleared has been increasing significantly over recent years, although it slightly decreased from the previous year in 2009, but still remains at a high level.
Fig. 3-4-1-1 Number of persons cleared for non-traffic penal code offenses by age group (1990-2009)
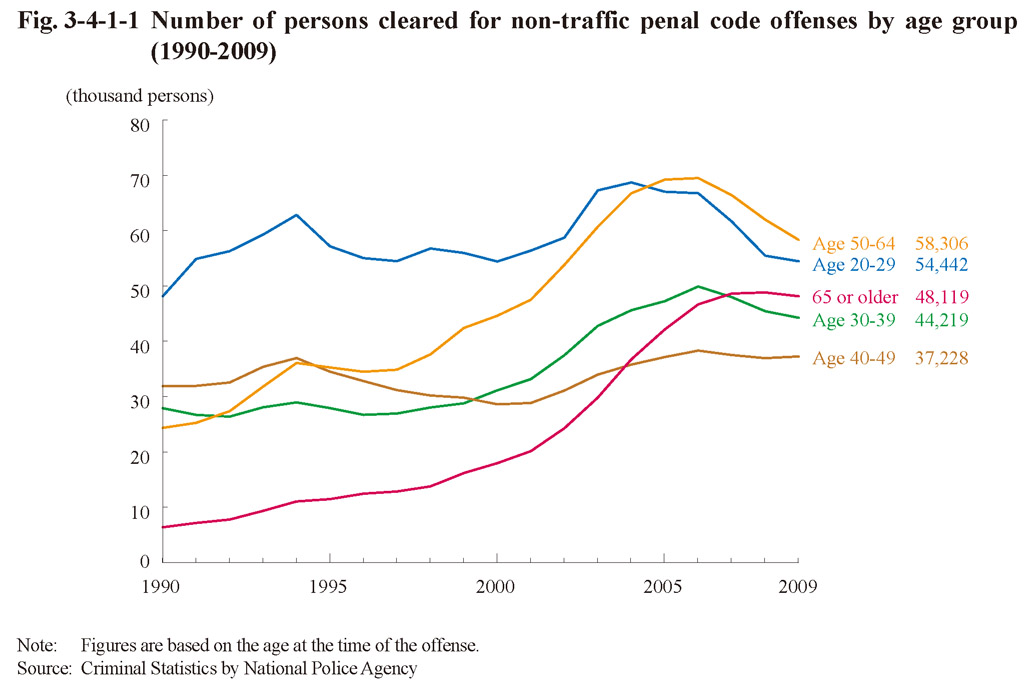
Fig. 3-4-1-2 shows the rate per population of persons cleared for non-traffic penal code offenses by age group over the last 20 years. The rate per population of elderly persons was relatively low when compared to other age groups, but examining the rate of rise of the rate per population by age group revealed that the rate per population rose in 2009 from 1990 only by approximately 1.3 times with the 20-29 age group, approximately 1.5 times with the 30-39 age group, approximately 1.4 times with the 40-49 age group, and approximately 2.1 times with the 50-64 age group, but approximately 3.9 times with elderly persons, thereby indicating the remarkable rise in rate per population of elderly persons. As indicated above the increase of elderly offenders in recent years far exceeds that of the total elderly population.
Fig. 3-4-1-2 Rate per population of persons cleared for non-traffic penal code offenses by age group (1990-2009)
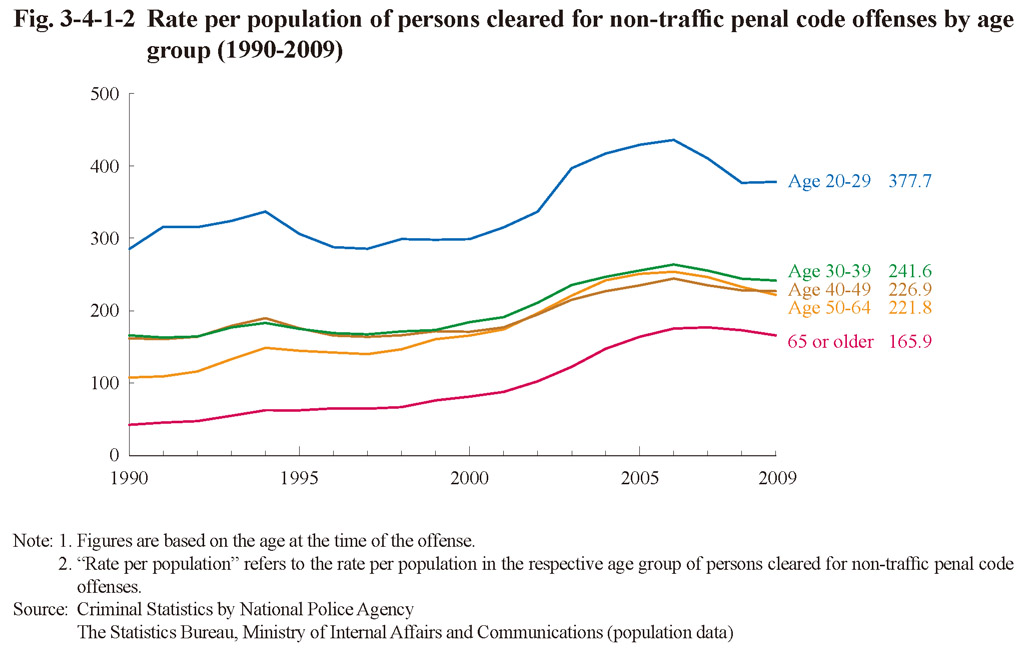
Fig. 3-4-1-3 shows the percent distribution of elderly persons cleared for non-traffic penal code offenses by gender and type of offense in 2009. Theft was the highest in proportion, especially among females at 89.6%, but with shoplifting also being remarkably high at 81.1%.
Fig. 3-4-1-3 Percent distribution of elderly offenders cleared for non-traffic penal code offenses by gender and type of offense (2009)
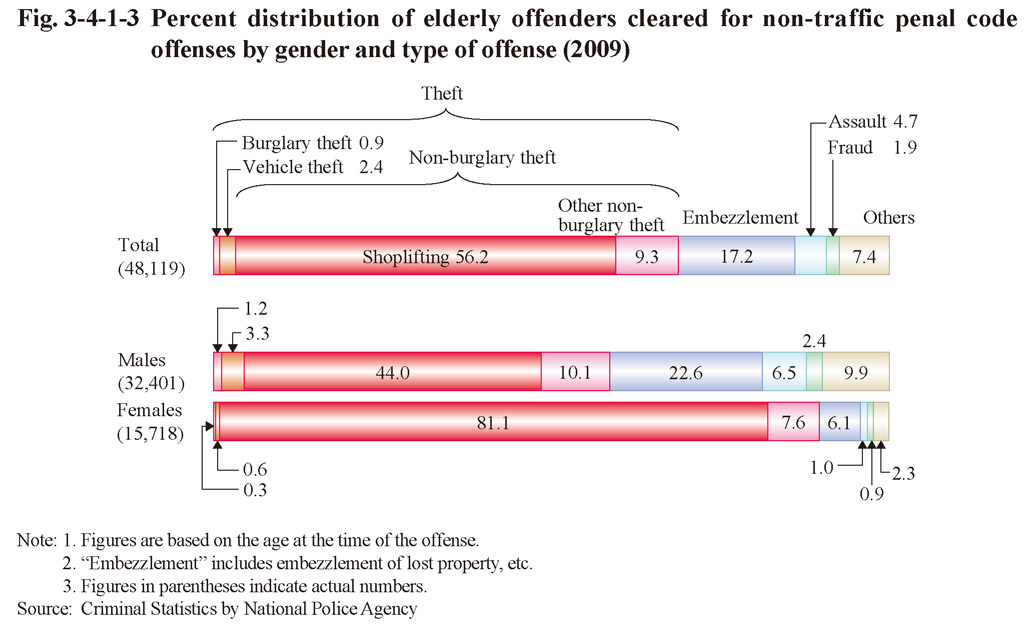
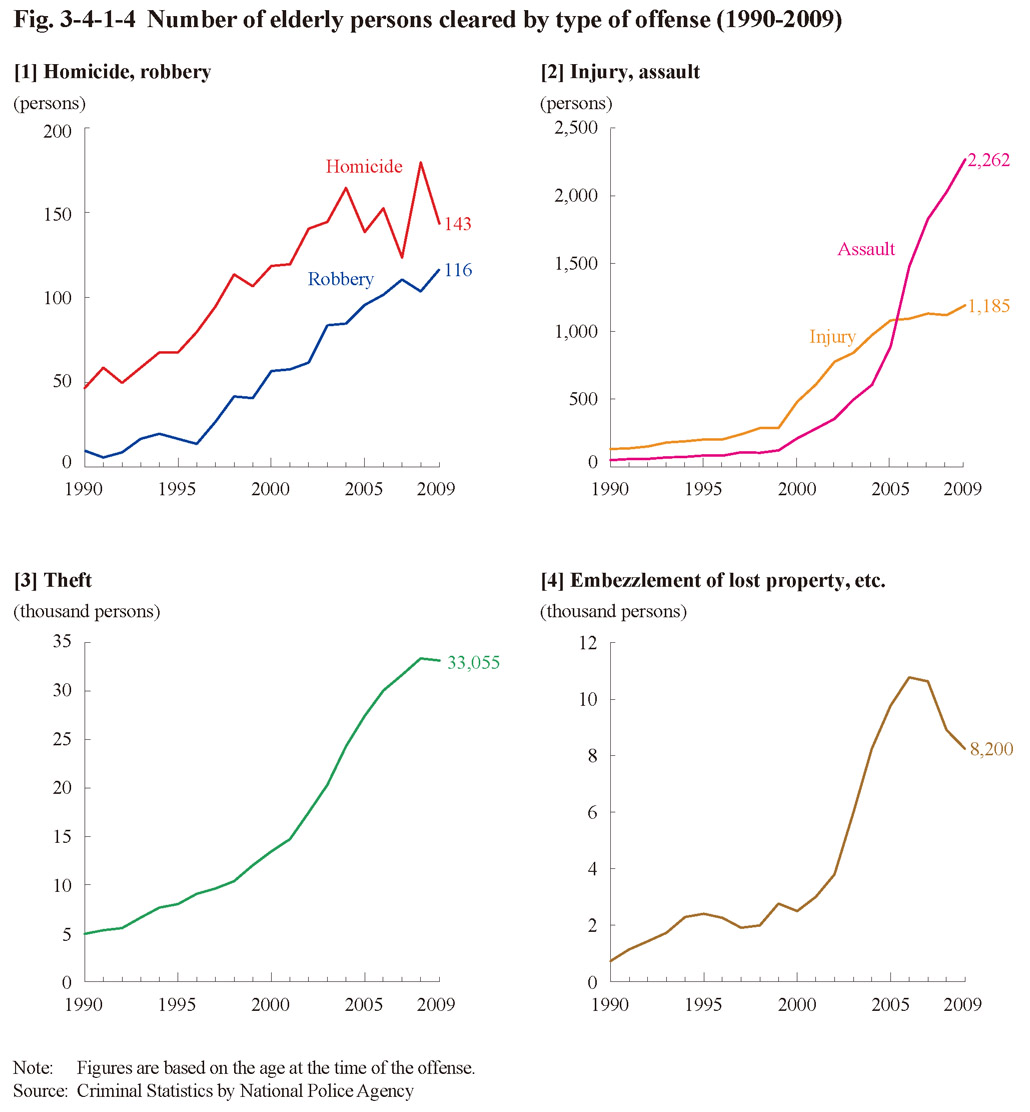
Fig. 3-4-1-4 shows the number of elderly persons cleared for specific penal code offenses by age group over the last 20 years. The number of elderly persons cleared was approximately 3.1 times higher for homicide, approximately 12.9 times higher for robbery, approximately 52.6 times higher for assault, approximately 9.5 times higher for injury, approximately 6.8 times higher for theft, and approximately 11.8 times higher for embezzlement of lost property, etc. in 2009 than that in 1990.
Fig. 3-4-1-4 Number of elderly persons cleared by type of offense (1990-2009)