4 Characteristics of new inmates
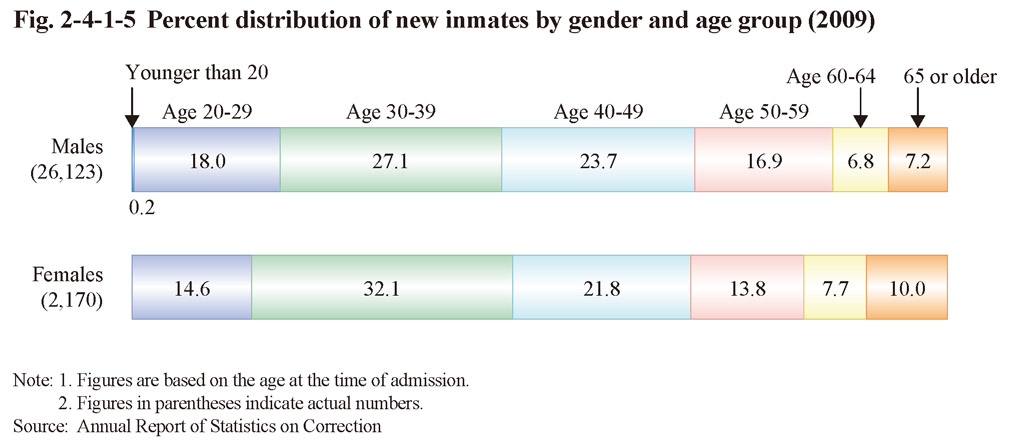
(1) Age
Fig. 2-4-1-5 shows the percent distribution of new inmates by gender and age group in 2009. The proportion of those aged 30 to 39 was the highest with both males and females. The proportion of older inmates was higher with females than males.
Fig. 2-4-1-5 Percent distribution of new inmates by gender and age group (2009)
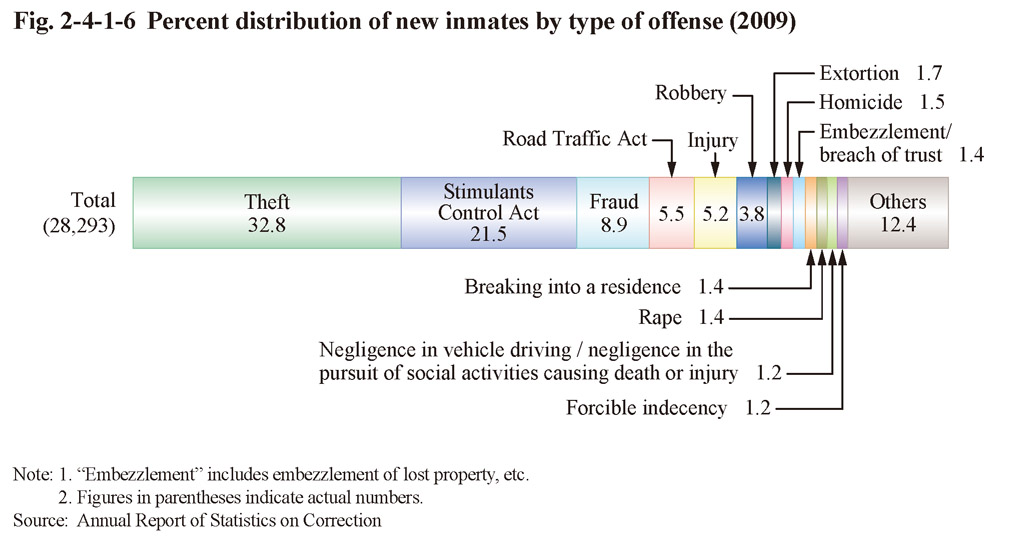
(2) Type of offense
Fig. 2-4-1-6 shows the percent distribution of new inmates by type of offense in 2009. The proportion for theft (32.8%) and Stimulants Control Act violations (21.5%) was remarkably high, with the two offenses accounting for the majority of new inmates. With females the proportion for Stimulants Control Act violations was the highest at 36.4%, followed by theft at 35.9%, fraud at 7.6%, and then homicide at 3.7% (See Appendix 2-6).
Fig. 2-4-1-6 Percent distribution of new inmates by type of offense (2009)
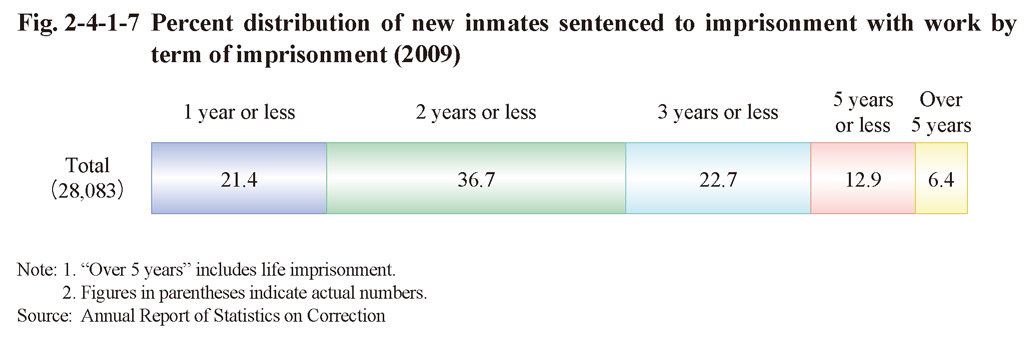
(3) Type of sentence and term of imprisonment
Examining the type of sentence of new inmates in 2009 revealed that 28,083 persons (99.3%) were sentenced to imprisonment with work, 191 (0.7%) to imprisonment without work, and 12 to misdemeanor imprisonment without work. Fig. 2-4-1-7 shows the percent distribution of new inmates by term of imprisonment in 2009 (See Appendix 2-10 for the number of inmates sentenced to imprisonment with work by term as of the end of the year).
Fig. 2-4-1-7 Percent distribution of new inmates sentenced to imprisonment with work by term of imprisonment (2009)