2 Persons cleared
The number of persons cleared for penal code offenses exceeded one million in 1998, and subsequently reached new post WWII highs every year from 1999 through to 2004 (at 1,289,416), then starting to decrease in 2005. It was 1,051,838 (down 30,117 or 2.8% from the previous year) in 2009 (See Fig. 1-1-1-1).
Table 1-1-1-2 shows the number of persons cleared for penal code offenses by type of offense in 2009 and Fig. 1-1-1-3 [2] the percent distribution by type of offense. Examining the number of persons cleared revealed that 68.3% of the total was cleared for negligence in vehicle driving causing death or injury, etc.
Fig. 1-1-1-5 shows the percent distribution of persons cleared for non-traffic penal code offenses by age group over the last 30 years (See Appendix for females). In recent years the aging of society has been progressing. The proportion of those aged 60 or older was 3.2% (12,376 persons) in 1980 but then rose to 20.6% (68,538 persons) in 2009. Elderly persons aged 65 or older accounted for 14.4% (48,119 persons) (See Section 1, Chapter 4, Part 3).
Fig. 1-1-1-5 Percent distribution of persons cleared for non-traffic penal code offenses by age group (1980-2009)
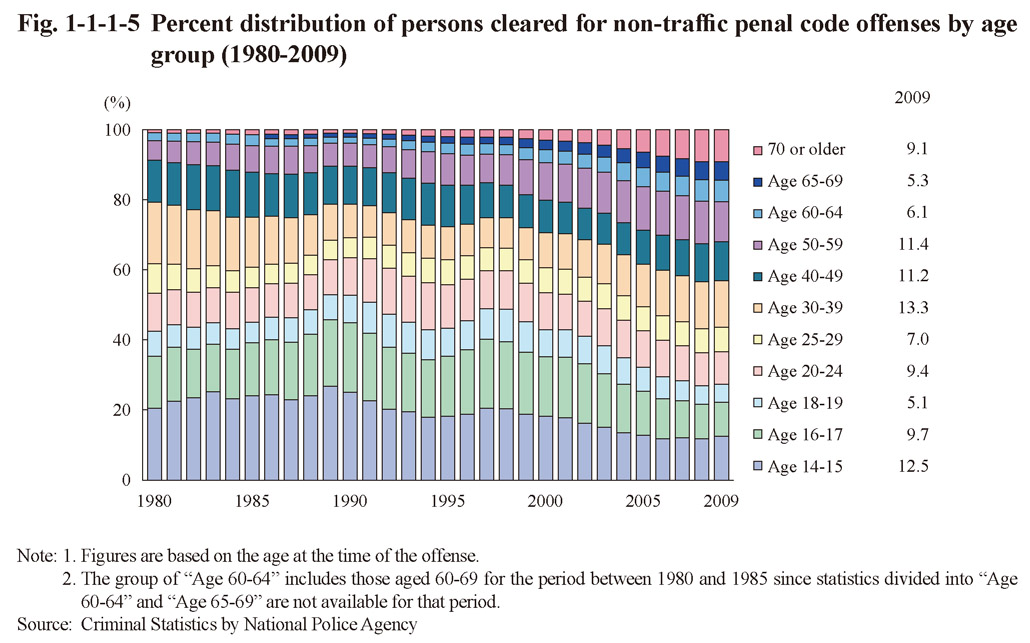
Fig. 1-1-1-6 shows the number of females cleared for non-traffic penal code offenses and rate per population from 1946 on. The number of females cleared for non-traffic penal code offenses reached peaks in 1950 (within the range between 54 and 55 thousand), 1964 (within the range between 51 and 52 thousand), and 1983 (within the range between 83 and 84 thousand). It then reached another high after 1983 in the range between 82 and 83 thousand in 1988, but then largely decreased for a while after 1989. However, after hitting a minimum within the range between 52 and 53 thousand in 1992 it then started to increase again from 1993 on, reaching the new post WWII high of 84,175 in 2005. It started to decrease again from 2006 on, however, and was 70,234 (down 2,890 or 4.0% from the previous year) in 2009.
Fig. 1-1-1-6 Number of females cleared for non-traffic penal code offenses and rate per population (1946-2009)
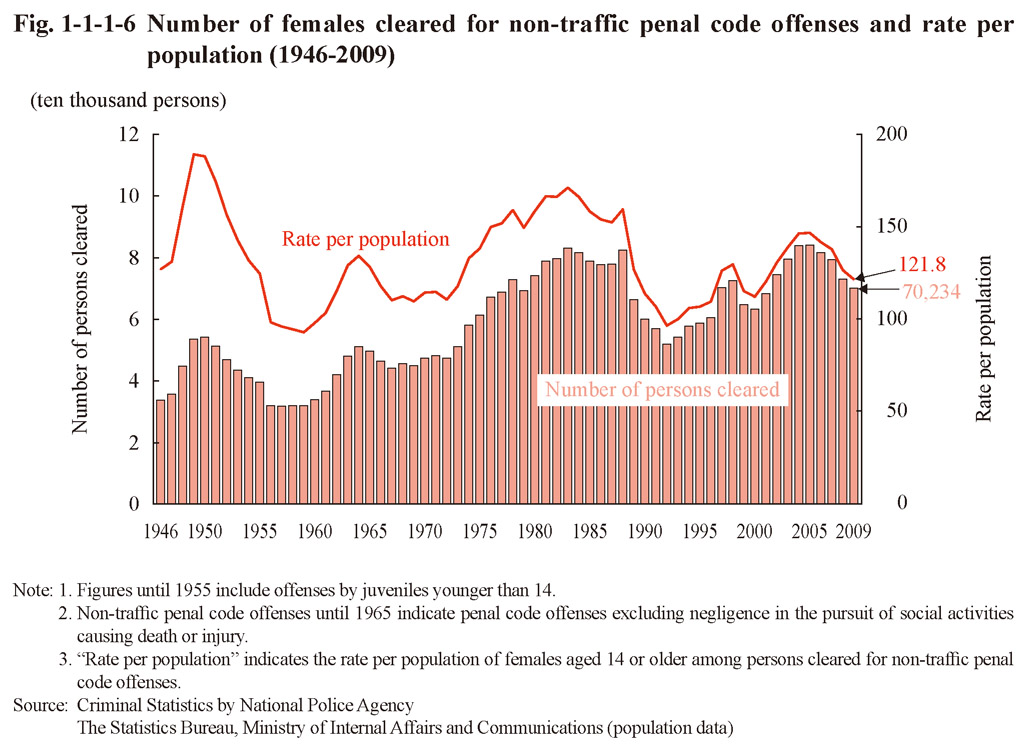
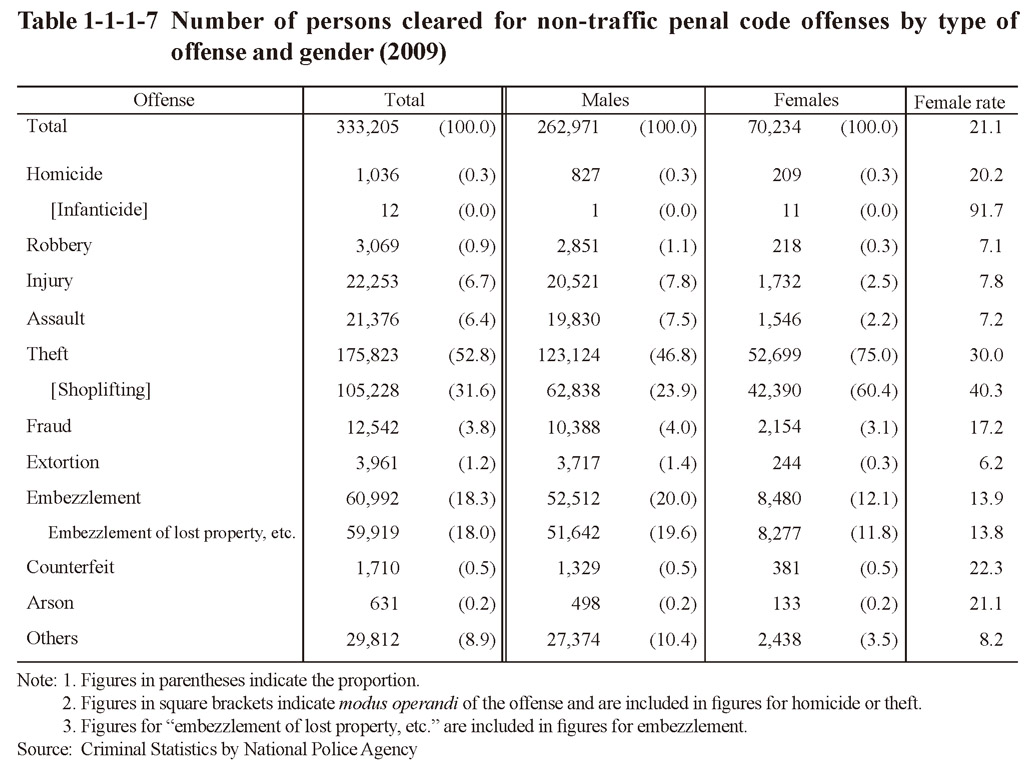
Table 1-1-1-7 shows the number of persons cleared for non-traffic penal code offenses by type of offense and by gender in 2009. With males the proportion was the highest for theft at 46.8%, and then followed by embezzlement (20.0%). With females the proportion for theft was dominantly high at 75.0%, and then followed by embezzlement at 12.1%. The female rate was overwhelming high for infanticide at 91.7% and also remarkably high for shoplifting at 40.3%.
Table 1-1-1-7 Number of persons cleared for non-traffic penal code offenses by type of offense and gender (2009)