| Previous Next Index Image Index Year Selection | |
|
|
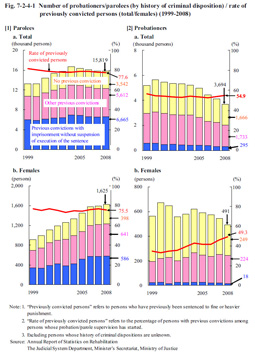
1 Status of probationers/parolees (1) Persons previously convicted among those placed under probation/parole supervisionFig. 7-2-4-1 shows the number of previously convicted persons (refers to persons who had previously been sentenced to fine or heavier punishment in a final judgment; hereinafter the same in this subsection) who are placed under probation/parole supervision and the rate of previously convicted persons (refers to the percentage of persons with previous convictions among persons placed under probation/parole supervision; hereinafter the same in this subsection) over the last 10 years. The number of previously convicted persons among parolees had been on an increasing trend until 2004 but then turned to a slight decreasing trend from 2005, while that among probationers was on a decreasing trend from 2001. The rate of previously convicted persons is leveling off overall, but that of female probationers is on an increasing trend. Fig. 7-2-4-1 Number of probationers/parolees (by history of criminal disposition) / rate of previously convicted persons (total/females) (1999–2008)
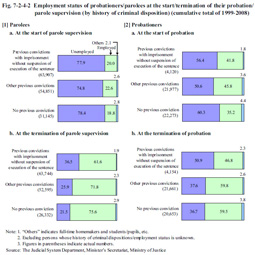
Fig. 7-2-4-2 shows the employment status of probationers/parolees (cumulative total of 1999 to 2008) at the start/termination of their probation/parole supervision by history of criminal disposition. It is rather difficult to make a strict comparison here, as those whose probation/parole supervision first started and those whose probation/parole supervision was terminated the same year are not necessarily the same people. However, the rate of employed persons was generally higher at the termination of probation/parole supervision than at the start of supervision. The rate of increase was relatively low among probationers with a history of “previous convictions with imprisonment without suspension of execution of the sentence.” Fig. 7-2-4-2 Employment status of probationers/parolees at the start/termination of their probation/parole supervision (by history of criminal disposition) (cumulative total of 1999–2008)
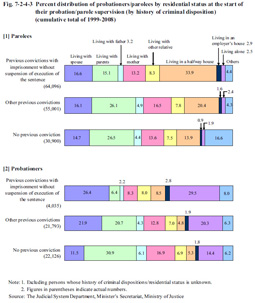
Fig. 7-2-4-3 shows the percent distribution of probationers/parolees (cumulative total of 1999 to 2008) by residential status at the start of their probation/parole supervision and by history of criminal disposition. The proportion of those living in halfway houses was high among parolees, accounting for over 1/3 of parolees with a history of “previous convictions with imprisonment without suspension of execution of the sentence.” Many probationers utilize halfway houses as residences as well. Furthermore, the proportion of those living alone was high among probationers, accounting for about 30% of those with a history of “previous convictions with imprisonment without suspension of execution of the sentence.” Fig. 7-2-4-3 Percent distribution of probationers/parolees by residential status at the start of their probation/parole supervision (by history of criminal disposition) (cumulative total of 1999–2008)
|