| Previous Next Index Image Index Year Selection | |
|
|
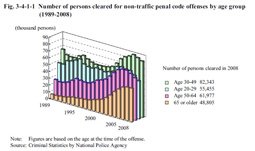
Although the number of persons cleared for non-traffic penal code offenses has started decreasing in recent years for age groups under 65, the number of elderly persons cleared has remained on an increasing trend. Fig. 3-4-1-1 Number of persons cleared for non-traffic penal code offenses by age group (1989–2008)
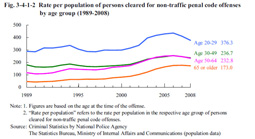
The rate per population of elderly persons was relatively low when compared to other age groups. However, the rate per population of elderly persons in 2008 (173.0) exceeded that of the age groups of 30-49 (168.6) and 50-64 (146.8) in 1998. In addition, examining the rate of increase of the rate per population by age group revealed that the rate per population increased in 2008 from 1989 by approximately 1.3 times for the 20-29 age group, approximately 1.3 times for 30-49, and approximately 2.0 times for 50-64, but approximately 3.7 times for elderly persons, thus indicating the remarkable increase in the rate per population of elderly persons. As indicated above, the increase of offenses committed by elderly offenders in recent years far exceeds that of the total elderly population. Fig. 3-4-1-2 Rate per population of persons cleared for non-traffic penal code offenses by age group (1989–2008)
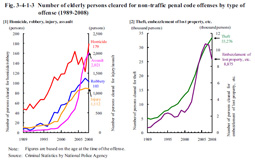
The number of elderly persons cleared for these offenses has been increasing sharply, as revealed by the fact that the numbers were approximately 4 times larger for homicide, approximately 13 times larger for robbery, approximately 42 times larger for assault, approximately 8 times larger for injury, approximately 6 times larger for theft, and approximately 14 times larger for embezzlement of lost property, etc. in 2008 than they were in 1989. Fig. 3-4-1-3 Number of elderly persons cleared for non-traffic penal code offenses by type of offense (1989–2008)
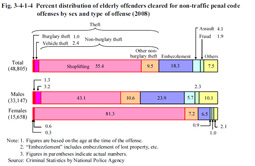
Theft was the highest in proportion, especially among females at 89.4%, with shoplifting being remarkably high at 81.3%. Fig. 3-4-1-4 Percent distribution of elderly offenders cleared for non-traffic penal code offenses by sex and type of offense (2008)
|