|
Section 2 Trends in Offenses
1 Persons cleared
Fig. 3-2-2-1 shows the number of Boryokudan members, etc. cleared (limited to non-traffic penal code offenses and special act offenses excluding violations of road traffic related acts; hereinafter the same in this subsection) over the last 30 years.
The number remained within the range of 30 thousands from 1989, but fell to below 30,000 from 2004, and was 26,064 in 2008 (down 4.1% from the previous year).
Fig. 3-2-2-1 Number of Boryokudan members, etc. cleared (1979–2008)
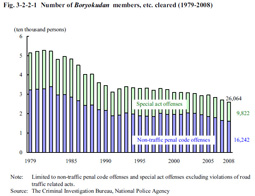
Table 3-2-2-2 shows the number of Boryokudan members, etc. and the percentage to total persons cleared in 2008 by type of offense.
Table 3-2-2-2 Number of Boryokudan members, etc. cleared by type of offense (2008)
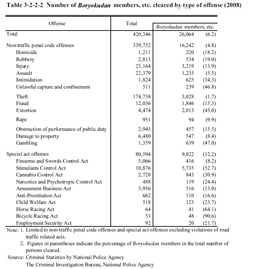
The number of Boryokudan members, etc. cleared was the largest for Stimulants Control Act violations, followed by injury, theft, and extortion, in that order. The percentage of Boryokudan members, etc. to total persons cleared was 6.2% for all offenses. By type of offense the percentage was high for gambling (47.0%), unlawful capture and confinement (46.8%), and extortion (45.0) for non-traffic penal code offenses, and Bicycle Racing Act violations (90.6%), Horse Racing Act violations (64.1%), Stimulants Control Act violations (52.7%), and Cannabis Control Act violations (30.9%) for special act offenses.
|