Previous   Next        Index   Image Index   Year Selection
 White paper on crime 2009 Part1/Chapter2/Section1 

Chapter 2  Special Act Offenses

Section 1  Principal Data

  The principal data on special act offenses (including ordinance violations; hereinafter the same) in 2008 are as follows.

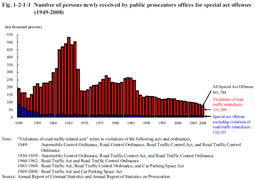
Principal data on special act offenses, 2008
                                                          Number of persons
                                                          newly received by   (percent ratio)    (Year-on-year change)
                                                          public prosecutors
                                                          offices
[1]   Road Traffic Act violations                     525,862       (81.9%)        (–89,127,      –14.5%)
[2]   Stimulants Control Act violations             18,267       (2.8%)          (–2,021,        –10.0%)
[3]   Minor Offense Act violations                    15,612       (2.4%)           (–586,          –3.6%)
[4]   Waste Management Act violations            8,588         (1.3%)            (–291,         –3.3%)
[5]   Immigration Control Act violations          6,801        (1.1%)             (–1,775,      –20.7%)
[6]   Firearms and Swords Control Act              6,353       (1.0%)             (–298,         –4.5%)
       violations
[7]   Car Parking Spaces Act violations              5,527        (0.9%)          (–1,394,      –20.1%)
[8]   Automobile Liability Security Act               4,817        (0.8%)          (–125,           –2.5%)
       violations
[9]   Amusement Business Act violations          4,387          (0.7%)            (–513,        –10.5%)
[10] Cannabis Control Act violations               4,058          (0.6%)            (+509,        +14.3%)
       Others                                                       41,472          (6.5%)
        Total                                                      641,744      (100.0%)          (–99,979,   –13.5%)

                                                                  [Total in 1989]                     [Change from 1989]
                                                                            1,261,040                  [–619,296,      –49.1%]

                                                                    (Source: Annual Report of Statistics on Prosecution)

  Fig. 1-2-1-1 shows the number of persons newly received by public prosecutors offices for special act offenses since 1949.

Fig. 1-2-1-1  Number of persons newly received by public prosecutors offices for special act offenses (1949–2008)

  The number of persons received for overall special act offenses decreased sharply when the traffic infraction notification system came into force in July 1968 and remained within the range of two millions through 1975 to 1984. The number decreased sharply again due to expansion of the scope of the system in 1987 and has generally been on a decreasing trend. However, the number of persons received for special act offenses excluding violations of road traffic related acts started increasing from 2001, but then decreased by 7.9% from the previous year in 2008.
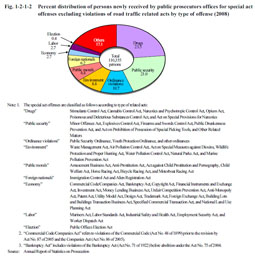
  Fig. 1-2-1-2 shows the percent distribution of persons newly received by public prosecutors offices for special act offenses excluding violations of road traffic related acts by type of offense in 2008.

Fig. 1-2-1-2  Percent distribution of persons newly received by public prosecutors offices for special act offenses excluding violations of road traffic related acts by type of offense (2008)