| Previous Next Index Image Index Year Selection | |
|
|
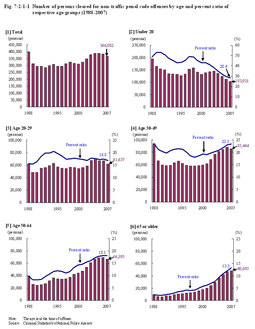
1 Number of persons cleared for non-traffic penal code offenses Fig. 7-2-1-1 shows the number of persons cleared for non-traffic penal code offenses by age and the percent ratio of respective age groups over the last 20 years. Fig. 7-2-1-1 Number of persons cleared for non-traffic penal code offenses by age and percent ratio of respective age groups (1988–2007)
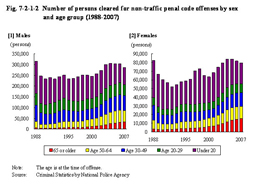
During the same period the total number of persons cleared had slightly decreased, although with some ups and downs, from 398,208 in 1988 to 366,002 in 2007 (down by 8.1%). The age groups of 20 through 29 and 30 through 49 remained at the same level as in 1988. In contrast to the elderly group, these figures significantly decreased for the age group of under 20, from 193,756 persons cleared at a percent ratio 48.7% in 1988 to 103,921 (down by 89,835 (46.4%) ) and 28.4% (down by 20.3 points) in 2007. Conversely however, for the age group of 50 through 64, who are a future reserve of elderly, the number of persons cleared and percent ratio both noticeably increased from 39,294 and 9.9% in 1998 to 66,395 (up by 27,101 (69.0%)) and 18.1% (up by 8.3 points) in 2007 respectively. Fig. 7-2-1-2 shows the number of persons cleared for non-traffic penal code offenses by sex and age group (over the last 20 years). Fig. 7-2-1-2 Number of persons cleared for non-traffic penal code offenses by sex and age group (1988–2007)
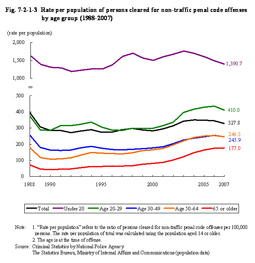
While the female rate of the number of persons cleared for non-traffic penal code offenses was 21.7% in 2007 (see Fig. 1-1-1-6), females accounted for 31.6% among elderly. The female rate was higher in the elderly group than in any other age group. There is no doubt that the rapid progress of aging in society has had some effect on the increase in crimes committed by elderly. As shown in the previous chapter, however, the number of elderly offenders is increasing at a much higher rate than the growth of the total elderly population. Fig. 7-1-2-3 shows the rate per population of persons cleared for non-traffic penal code offenses by age group over the last 20 years. Fig. 7-2-1-3 Rate per population of persons cleared for non-traffic penal code offenses by age group (1988–2007)
In general, the rate per population of persons cleared for non-traffic penal code offenses by age group tends to increase as the age of the group becomes younger. The rate per population of those under 20 years of age, in particular, is remarkably high when compared to other age groups. Examining the changes, however, reveals that it decreased by 234.2 points from 1,624.9 in 1988 to 1,390.7 in 2007. And conversely the rate per population of elderly decreased from 71.7 in 1988 to 42.6 in 1990, then turned to an increasing trend, reaching the level that is about 2.5 times as that of 1988 with 177.0 in 2007. It approached the level of the age group of 30 through 49 in 2000 and was higher than that of the age group of 50 through 64 in 2001. It should be noted that the rate per population of the age group of 50 through 64, which is a reserve of elderly, is also increasing at a noticeable rate. It decreased from 179.0 in 1988 to 107.8 in 1990, and then turned to an increasing trend. It reached about 1.4 times as that of 1988 at 246.3 and exceeded the rate per population of the age group of 30 through 49 (245.9) in 2007. As the aging of society is rapidly progressing, the situation in which crimes committed by elderly is increasing at a much higher rate than the growth of the total elderly population, with those by the reserve age group also remarkably increasing, suggests the possibility of further increases in the number of acts of crime by elderly in the future, and hence must not be overlooked. |