| Previous Next Index Image Index Year Selection | |
|
|
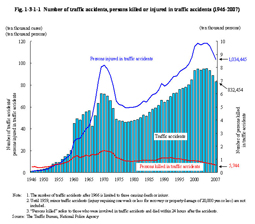
1 Trends in traffic offenses Fig. 1-3-1-1 shows the number of traffic accidents and the number of persons killed or injured in those accidents since 1946. The number of persons killed has been on the decline since 1993. In 2007, it was below 6,000 for the first time in 54 years since 1953. The number of traffic accidents and the number of persons injured in traffic accidents both have remained at a high level since 2000, however since 2005 there consecutively was a decrease from the previous year (see Appendix 1-5). Fig. 1-3-1-1 Number of traffic accidents, persons killed or injured in traffic accidents (1946–2007)
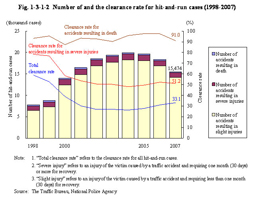
The number of persons cleared for dangerous driving causing death or injury was 425 (up by 11.8% from the previous year), and that for negligence in vehicle driving, etc. was 818,334 (down by 4.5% (id.)) in 2007 (see Table 1-1-1-2 of Part 1, Chapter 1, Section 1). Among these, the number of persons cleared for dangerous driving causing death was 54 (down by 10.0% (id.)), that for causing death through negligence in vehicle driving or negligence in the pursuit of social activities was 4,918 (down by 9.9% (id.)), and that for causing death through negligence (including causing death through gross negligence) was 28 (down by 28.2% (id.)) in 2007 (Source: The Traffic Bureau, National Police Agency). Fig. 1-3-1-2 shows the trends (over the last 10 years) in the number of and the clearance rate for hit-and-run cases (referring to cases of breach of duty to carry out first-aid pertaining to road traffic accidents causing death or injury; hereinafter the same in this section.). Fig. 1-3-1-2 Number of and the clearance rate for hit-and-run cases (1998–2007)
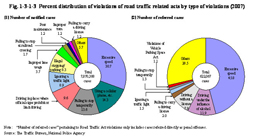
(3) Violations of road traffic related acts The total number of cases cracked down upon due to violations of road traffic related acts remained at around 8 million in the last five years, including the number of notified cases (of non-penal offense) under the traffic violation notification system (hereinafter referred to as the “number of notified cases” in this sub-section) and the number of cases referred to public prosecutors offices as penal offenses (hereinafter referred to as the “number of referred cases” in this sub-section), and it was 8,492,455 (down by 1.1% from the previous year) in 2007 (Source: The Traffic Bureau, National Police Agency) Fig. 1-3-1-3 shows the percent distribution of the number of cases cracked down on due to violations of road traffic related acts by type of violations divided into the notified cases and the referred cases in 2007. Fig. 1-3-1-3 Percent distribution of violations of road traffic related acts by type of violations (2007)
|