| Previous Next Index Image Index Year Selection | |
|
|
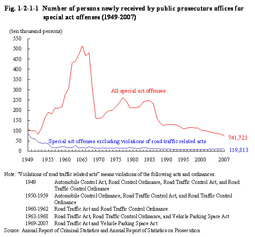
Principal data for 2007 (Special Act Offenses) Number of persons newly received by (percent ratio) (year-on-year change) public prosecutors offices [1] Road Traffic Act violations 614,989 (82.9%) (–86,371) (–12.3%) [2] Stimulants Control Act violations 20,288 (2.7%) (+144) (+0.7%) [3] Minor Offenses Act violations 16,198 (2.2%) (+1,378) (+9.3%) [4] Waste Management Act violations 8,879 (1.2%) (+1,029) (+13.1%) [5] Immigration Control Act violations 8,576 (1.2%) (–2,976) (–25.8%) [6] WCar Parking Spaces Act violations 6,921 (0.9%) (–2,593) (–27.3%) [7] Firearms and Swords Control Act 6,651 (0.9%) (+661) (+11.0%) violations [8] Automobile Liability Security Act 4,942 (0.7%) (+108) (+2.2%) violations [9] Amusement Business Act violations 4,900 (0.7%) (+86) (+1.8%) [10] Cannabis Control Act violations 3,549 (0.5%) (+50) (+1.4%) Others 45,830 (6.2%) Total 741,723 (100.0%) (–87,086) (–10.5%) (Source: Annual Report of Statistics on Prosecution) Fig. 1-2-1-1 shows the trend in the number of persons newly received by public prosecutors offices since 1949 for Special Act Offenses. The total number of special act offenses decreased sharply when the traffic violation notification system came into force in July 1968 and remained on the range of 2 million persons through 1975 to 1984. The number decreased sharply again due to the expansion of the scope of this system in 1987 and has generally been on a declining trend. Meanwhile, the number of special act offenses excluding violations of road traffic related acts has been increasing since 2001 (93,761 in 2001, 110,363 in 2004, and 119,813 in 2007). Fig. 1-2-1-1 Number of persons newly received by public prosecutors offices for special act offenses (1949–2007)
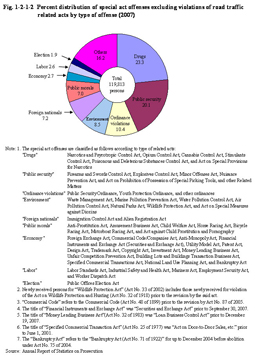
Fig. 1-2-1-2 Percent distribution of special act offenses excluding violations of road traffic related acts by type of offense (2007)
|