| Previous Next Index Image Index Year Selection | |
|
|
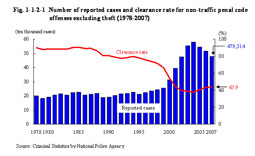
1 Overview The number of cases reported for non-traffic penal code offenses excluding theft has increased rapidly since 2000 and reached the post WWII high at 581,463 in 2004. However, it turned and declined in 2005, decreasing by 37,387 (7.2%) from the previous year in 2007. In comparison to the previous year, the number of cleared cases decreased by 14,206 cases (6.3%) to 210,549 cases, while the number of persons cleared decreased by 11,420 persons (5.8%) to 18 5,556 persons in 2007. The clearance rate, which used to be around 90%, has declined sharply in recent years, registering the lowest level in the post WWII period at 37.8% in 2004. However, it recovered slightly for three consecutive years to 40.5% in 2005, 43.5% in 2006 and 43.9% in 2007. Fig. 1-1-2-1 Number of reported cases and clearance rate for non-traffic penal code offenses excluding theft (1978–2007)
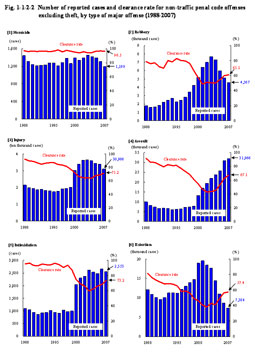
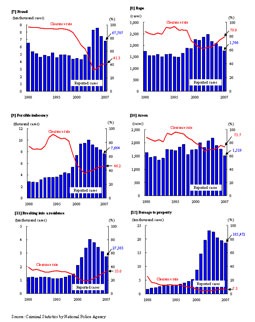
Fig. 1-1-2-2 Number of reported cases and clearance rate for non-traffic penal code offenses excluding theft, by type of major offense (1988–2007)
|