| Previous Next Index Image Index Year Selection | |
|
|
4 Attributes
Here an overview is provided of the attributes of repeat offenders using statistical data on newly admitted sentenced inmates. More specifically, the sex, employment status, Boryokudan group membership, intellectual level and spousal status, respectively, of first-time inmates (a person who has been imprisoned for the first time; hereinafter the same in this chapter) and repeat inmates (a person who has been previously imprisoned once or more; hereinafter the same in this chapter) among newly admitted sentenced inmates are examined.
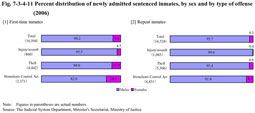
Fig. 7-3-4-11 shows the percent distribution of newly admitted sentenced inmates by sex, and by type of offense, divided into first-time inmates and repeat inmates in 2006. The percentage of females to total number of first-time inmates was 9.8%, while it was 4.3% in the case of repeat inmates. The percentage of repeat inmates to the total of first-time and repeat inmates was 51.5% in the case of males, while it was 30.6% in the case of females. This then reveals that males have a stronger tendency for recidivism and repeated imprisonment. By type of offense, the percentage of female repeat inmates is noticeably low at 0.4% for injury/assault. Fig. 7-3-4-11 Percent distribution of newly admitted sentenced inmates, by sex and by type of offense (2006)
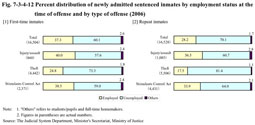
With each type of offense, the percentage of unemployed was higher with repeat inmates than with first-time inmates, and particularly high (81.4%) for repeat inmates with theft. Fig. 7-3-4-12 Percent distribution of newly admitted sentenced inmates by employment status at the time of offense and by type of offense (2006)
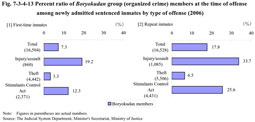
The percent ratio of those who were members of Boryokudan groups was higher with repeat inmates than with first-time inmates in every type of offense. The percent ratio of Boryokudan group members was particularly high at 33.7% in the case of repeat inmates with injury/assault. Fig. 7-3-4-13 Percent ratio of Boryokudan group (organized crime) members at the time of offense among newly admitted sentenced inmates by type of offense (2006)
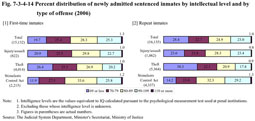
Fig. 7-3-4-14 Percent distribution of newly admitted sentenced inmates by intellectual level and by type of offense (2006)
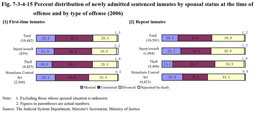
Persons with no spouse stand out with repeat inmates for theft. Fig. 7-3-4-15 Percent distribution of newly admitted sentenced inmates by spousal status at the time of offense and by type of offense (2006)
|