| Previous Next Index Image Index Year Selection | |
|
|
1 Juveniles newly admitted to juvenile training schools
(1) Number of juveniles newly admitted to juvenile training schools
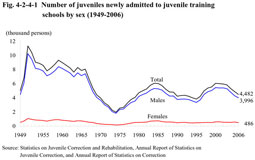
Fig. 4-2-4-1 shows the number of juveniles newly admitted to juvenile training schools by sex since 1949. The number of newly admitted juveniles increased sharply in the 1950s due to the postwar chaos of the society and economy, generally remaining in the range of 8,000 to 12,000, but continued declining after that to hit the bottom at 1,969 in 1974. However, the number started to increase again and has been around 4,000 to 6,000 in recent years (see Appendix 4-12). Fig. 4-2-4-1 Number of juveniles newly admitted to juvenile training schools by sex (1949-2006)
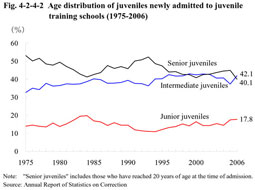
(2) Characteristics of juveniles newly admitted to juvenile training schools a. Age Fig. 4-2-4-2 shows the age distribution of juveniles newly admitted to juvenile training schools since 1975. The percent ratio for senior juveniles and that for intermediate juveniles have generally been around 40% since 1994. Fig. 4-2-4-2 Age distribution of juveniles newly admitted to juvenile training schools (1975-2006)
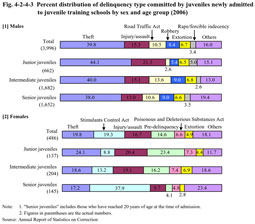
b. Type of delinquency Fig. 4-2-4-3 shows the percent distribution of delinquency type committed by juveniles newly admitted to juvenile training schools in 2006 by sex and age group. By sex, theft accounted for the highest proportion in both males and females, but the ratio for Stimulants Control Act violations is also high for females. By age group, as the age group shifted from junior to senior, the ratio for theft and injury/assault fell for males. For females, as the age group shifted from junior to senior, the ratio for Stimulants Control Act violations rose, and the ratios for pre-delinquency and injury/assault fell (see Appendix 4-13). Fig. 4-2-4-3 Percent distribution of delinquency type committed by juveniles newly admitted to juvenile training schools by sex and age group (2006)
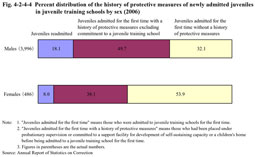
c. History of protective measures Fig. 4-2-4-4 shows the percent distribution of the history of protective measures of juveniles newly admitted to juvenile training schools in 2006 by sex. Compared to males, females without a history of protective measures accounted for a higher percentage. Fig. 4-2-4-4 Percent distribution of the history of protective measures of newly admitted juveniles in juvenile training schools by sex (2006)
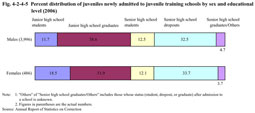
d. Education level Fig. 4-2-4-5 shows the percent distribution of juveniles newly admitted to juvenile training schools in 2006 by education level and by sex. In both males and females, the ratio for junior high school graduates and senior high school dropouts are high. 3 Fig. 4-2-4-5 Percent distribution of juveniles newly admitted to juvenile training schools by sex and educational level (2006)
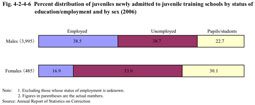
e. Education/employment status Fig. 4-2-4-6 shows the percent distribution of juveniles newly admitted to juvenile training schools in 2006 by status of education or employment and by sex. The ratio for unemployed, and pupils/students are higher and the ratio for employed is lower for females than for males. Fig. 4-2-4-6 Percent distribution of juveniles newly admitted to juvenile training schools by status of education/employment and by sex (2006)
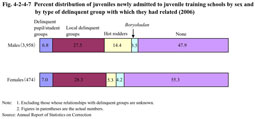
f. Relationship with delinquent groups Fig. 4-2-4-7 shows the percent distribution of juveniles newly admitted to juvenile training schools in 2006 by the type of delinquent groups with which they had related and by sex. In both males and females, among those who had related with delinquent groups, the ratio for those who had related with local delinquent groups was high. The ratio for those who had related with hot rodders was lower. Fig. 4-2-4-7 Percent distribution of juveniles newly admitted to juvenile training schools by sex and by type of delinquent group with which they had related (2006)
g. Guardians The percentage of juveniles newly admitted to juvenile training schools whose guardians are their biological parents was 39.1% (39.8% for males and 32.9% for females), down by nearly three points in total compared to the previous year (Source: Annual Report of Statistics on Correction). |