| Previous Next Index Image Index Year Selection | |
|
|
1 Number of juveniles cleared
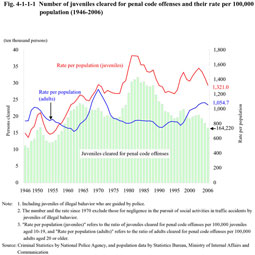
Fig. 4-1-1-1 shows the number of juveniles cleared for penal code offenses (including juveniles of illegal behavior who are guided by police, hereinafter the same in this subsection), their rates per 100,000 juveniles aged 10-19, and adults cleared for penal code offenses per 100,000 adults aged 20 or over since 1946 (see Appendix 4-1).
Fig. 4-1-1-1 Number of juveniles cleared for penal code offenses and their rate per 100,000 population (1946-2006)
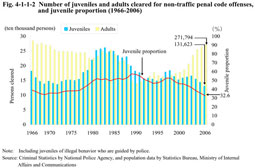
The number of juveniles cleared had been on a declining trend from 1984 to 1995. After going through slight ups and downs, it started increasing from 2001, but decreased for the third consecutive year from 2004. The population rate continued to decrease from 2004, but still maintains a high level. Fig. 4-1-1-2 shows the number of juveniles and adults cleared for non-traffic penal code offenses (including juveniles of illegal behavior who are guided by police) as well as the juvenile proportion to the total persons cleared since 1966. The trends in the number of juveniles cleared for non-traffic penal code offenses (including juveniles of illegal behavior who are guided by police) are almost the same as those in the number of juveniles cleared for penal code offenses. The juvenile proportion has continued to decrease as a result of increase in the number of adults cleared since 1998. Fig. 4-1-1-2 Number of juveniles and adults cleared for non-traffic penal code offenses, and juvenile proportion (1966-2006)
|