| Previous Next Index Image Index Year Selection | |
|
|
2 Correction
(1) Imprisonment of convicts related to Boryokudan groups
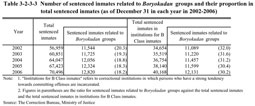
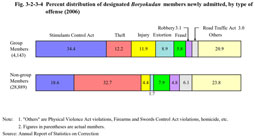
Table 3-2-3-3 shows the number of convicted inmates related to Boryokudan groups and their percentage ratio compared to the number of total convicted inmates over the last five years. Table 3-2-3-3 Number of sentenced inmates related to Boryokudan groups and their proportion in total sentenced inmates (as of December 31 in each year in 2002-2006) At penal institutions, guidance for breaking away from Boryokudan is provided as special rehabilitation guidance (see Part 2, Chapter 4, Section 4, 3 (2)). This guidance, which is for Boryokudan members specified by the Anti-Boryokudan Act, aims to remove problems those inmates suffer from and foster their will to break away from Boryokudan. With cooperation from police organizations, etc., guidance is provided through lectures, discussions, personal interviews, and composition writing assignments.(2) Characteristics of designated Boryokudan members in newly admitted inmates Among newly sentenced inmates admitted in 2006, 4,143 (12.5% of the total) were identified as Boryokudan members (members of designated Boryokudan groups under the Anti-Boryokudan Act; hereinafter the same in this subsection). Of them, 1,238 were group leaders, 2,549 were regular members, and 356 were unknown for their status in the group (Source: Annual Report of Statistics on Correction). a. Age As for the age of designated Boryokudan members newly admitted in 2006, the largest proportion of them were aged 30-39 (37.4%), followed by aged 40-49 (24.8%), aged 20-29 (17.6%), aged 50-59 (15.0%), and aged 60 or over (5.1%) (Source: Annual Report of Statistics on Correction). The ratio of those aged 30-39 and 40-49 was higher for newly admitted sentenced Boryokudan members than for all newly admitted sentenced inmates. b. Type of offense Figure 3-2-3-4 shows the percent distribution of designated Boryokudan members newly admitted in 2006, by type of offense. Fig. 3-2-3-4 Percent distribution of designated Boryokudan members newly admitted, by type of offense (2006) c. Term of sentenceExamining the term of sentence for designated Boryokudan members newly admitted in 2006, the largest number of them were sentenced to over one year but not more than two years (36.4%), followed by over two years but not more than three years (26.5%), over three years but not more than five years (13.3%), over six months but not more than one year (11.8 %), over five years (9.3%, including imprisonment for life), and not more than six months (2.7%) (Source: Annual Report of Statistics on Correction). The rate of those sentenced to over two years but not more than three years, over three years but not more than five years, and over five years (including imprisonment for life) was higher for newly admitted designated Boryokudan members than for all newly admitted convicted inmates. d. History of imprisonment As for the history of imprisonment of designated Boryokudan members newly admitted in 2006, the highest was “the first time” with 29.0%, followed by “twice” with 19.9%, “three times” with 14.2%, “four times” with 9.6%, “five times” with 8.2%, “six to nine times” with 14.5%, and “10 times or more” with 4.7% (Source: Annual Report of Statistics on Correction). The rate was higher for all categories except “the first time” for newly admitted designated Boryokudan members than for all newly admitted sentenced inmates. |

