| Previous Next Index Image Index Year Selection | |
|
|
3 Sex offenders seen from the viewpoint of the number of cleared persons (1) Trends in the number of cleared adults and juveniles
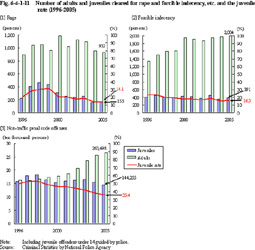
Fig. 6-4-1-11 shows trends in the numbers of adults and juveniles cleared for rape, forcible indecency, and non-traffic penal code offenses (including juvenile offenders under 14 guided by police) and the juvenile rate, over the past 10 years.
Fig. 6-4-1-11 Number of adults and juveniles cleared for rape and forcible indecency, etc. and the juvenile rate (1996-2005)
(2) Trends in the population ratio of cleared persons by age in 1966, 1985, and 2005
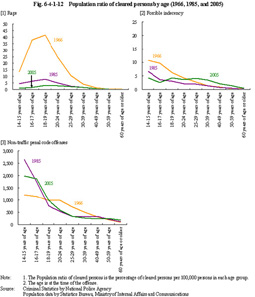
Fig. 6-4-1-12 shows trends in the population ratio of persons cleared for rape, forcible indecency, and non-traffic penal code offenses, by age (in 1966, 1985, and 2005).
Fig. 6-4-1-12 Population ratio of cleared persons by age (1966, 1985, and 2005)
(3) State of employment at the time of the offense
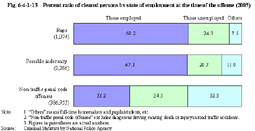
Fig. 6-4-1-13 shows the percent ratio of persons cleared for rape, forcible indecency, and non-traffic penal code offenses (excluding dangerous driving causing death or injury in road traffic accidents; hereinafter the same in this Subsection) in 2005, by state of employment at the time of the offense.
Fig. 6-4-1-13 Percent ratio of cleared persons by state of employment at the time of the offense (2005)
(4) Trends in the complicity rate
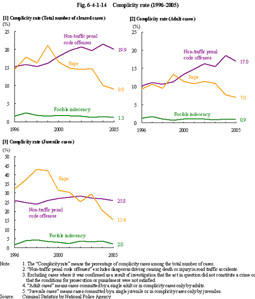
Fig. 6-4-1-14 shows trends in the complicity rate (meaning the percentage of complicity cases among the total number of cases) among the overall cleared cases for rape, forcible indecency, and non-traffic penal code offenses over the last 10 years.
Fig. 6-4-1-14 Complicity rate (1996-2005)
(5) The rate of repeat offenders and the rate of offenders with previous convictions
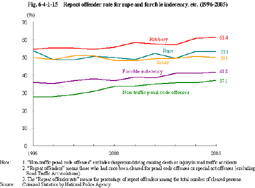
Fig. 6-4-1-15 shows trends in the rate of repeat offenders (meaning those who had once been cleared for penal code offenses or special act offenses (excluding Road Traffic Act violations)) among the total number of persons cleared for rape, forcible indecency, robbery, injury, and non-traffic penal code offenses, respectively, (hereinafter referred to as the "repeat offender rate" in this Subsection), over the last 10 years.
Fig. 6-4-1-15 Repeat offender rate for rape and forcible indecency, etc. (1996-2005)
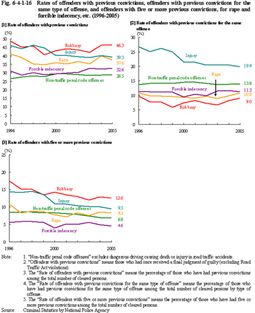
Fig. 6-4-1-16 Rates of offenders with previous convictions, offenders with previous convictions for the same type of offense, and offenders with five or more previous convictions, for rape and forcible indecency, etc. (1996-2005)
|