| Previous Next Index Image Index Year Selection | |
|
|
2 Reported cases for theft by type and modus operandi
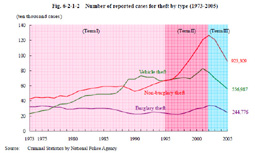
Changes in the number of reported cases for non-traffic penal code offenses have mostly depended on those for theft. The number of reported cases for non-traffic penal code offenses and that for theft have almost shown the same trends, and the number of reported cases for theft accounted for nearly 76% of that for overall non-traffic penal code offenses in 2005. Therefore, we will examine the trends in theft by type and modus operandi.
Fig. 6-2-1-2 shows trends in the number of reported cases for theft by type. Fig. 6-2-1-2 Number of reported cases for theft by type (1973-2005)
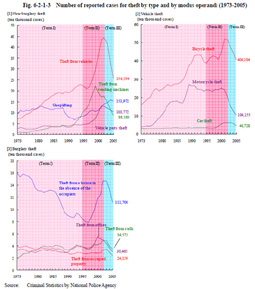
Fig. 6-2-1-3 shows trends in the number of reported cases for theft by type and by modus operandi. Fig. 6-2-1-3 Number of reported cases for theft by type and by modus operandi (1973-2005)
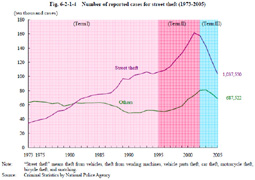
In Term I, theft from vehicles, bicycle theft, and motorcycle theft increased, while theft from a house in the absence of the occupiers decreased. However, in the latter part of this term, theft from vending machines increased sharply, and bicycle theft and motorcycle theft decreased slightly. In Term II, almost all types of theft showed rising trends. In particular, theft from vehicles increased by nearly 0.22 million cases from 1995 to 2002, accounting for nearly 27% of the total increase of theft during the same period (nearly 0.81 million cases). In Term III, many of these thefts such as theft from vehicles and theft from a house in the absence of the occupiers started to show decreases. However, shoplifting continued to increase until 2004 and decreased only slightly in 2005. Fig. 6-2-1-4 shows trends in the number of reported cases for street theft mainly committed on the street or out of doors (meaning theft from vehicles, theft from vending machines, vehicle parts theft, car theft, motorcycle theft, bicycle theft, and snatching; hereinafter the same) and others. Street theft was on a rise even in Term I, but increased sharply in Term II, accounting for nearly 63% of the increase during this period of time. Street theft hit a peak in 2001 and started to decrease significantly from 2003. The decrease of street theft from 2002 to 2005 (nearly 0.54 million cases) accounted for nearly 82% of the decrease of overall theft (nearly 0.65 million cases) during the same period. The increase in the number of reported cases for theft in Terms I and II and the decrease in Term III are mostly attributable to changes in the number of street theft. Fig. 6-2-1-4 Number of reported cases for street theft (1973-2005)
|