| Previous Next Index Image Index Year Selection | |
|
|
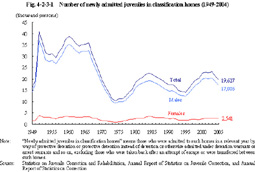
1 Admission and discharge (1) Number of newly admitted juveniles in classification homes Fig. 4-2-3-1 shows the number of juveniles newly admitted to juvenile classification homes since 1949.
Fig. 4-2-3-1 Number of newly admitted juveniles in classification homes (1949-2004)
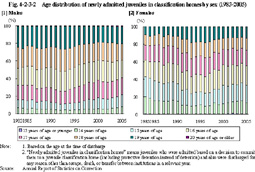
(2) Characteristics of newly admitted juveniles Fig. 4-2-3-2 shows the age distribution of newly admitted juveniles in classification homes since 1983 by sex.
Fig. 4-2-3-2 Age distribution of newly admitted juveniles in classification homes by sex (1983-2005)
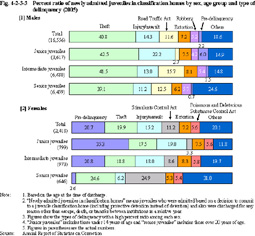
Fig. 4-2-3-3 Percent ratio of newly admitted juveniles in classification homes by sex, age group and type of delinquency (2005)
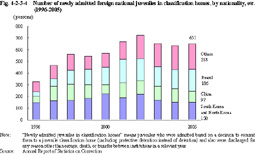
Fig. 4-2-3-4 Number of newly admitted foreign national juveniles in classification homes, by nationality, etc. (1996-2005)
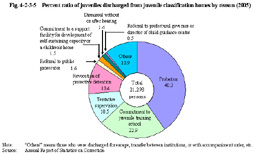
(3) Reasons for discharge Fig. 4-2-3-5 shows the percent ratio of juveniles discharged from juvenile classification homes by reason.
Fig. 4-2-3-5 Percent ratio of juveniles discharged from juvenile classification homes by reason (2005)
|