| Previous Next Index Image Index Year Selection | |
|
|
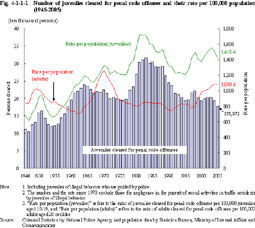
1 Number of juveniles cleared Fig. 4-1-1-1 shows the number of juveniles cleared for penal code offenses (including juveniles of illegal behavior who are guided by police, hereinafter the same in this subsection), their rates per 100,000 juveniles aged 10-19, and adults cleared for penal code offenses per 100,000 adults aged 20 or over since 1946 (See Appendix 4-1)
Fig. 4-1-1-1 Number of juveniles cleared for penal code offenses and their rate per 100,000 population (1946-2005)
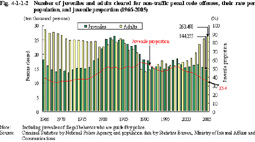
Fig. 4-1-1-2 Number of juveniles and adults cleared for non-traffic penal code offenses, their rate per population, and juvenile proportion (1966-2005)
|