| Previous Next Index Image Index Year Selection | |
|
|
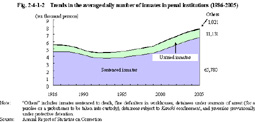
2 Number of inmates of penal institutions Fig. 2-4-1-2 shows the trends in the average daily number of inmates of penal institution over the last 20 years.
The average daily number of inmates in penal institutions registered the lowest record after the WW II at 44,876 in 1992, but has been on an increasing trend since 1993. It registered 77,932 in 2005, an increase of 2,643 persons or 3.5% from the previous year (See Appendix 2-5 for the number of inmates in penal institutions after 1950). Fig. 2-4-1-2 Trends in the average daily number of inmates in penal institutions (1986-2005)
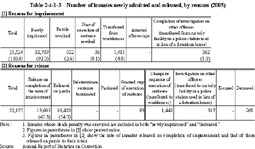
Table 2-4-1-3 Number of inmates newly admitted and released, by reasons (2005)
|