| Previous Next Index Image Index Year Selection | |
|
|
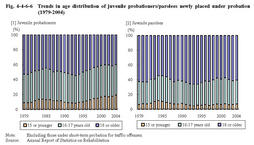
2 Characteristics of juvenile probationers/parolees (1) Age Fig.4-4-6-6 shows the age distribution of juvenile probationers(excluding juveniles under short-term probation for traffic offenses;hereinafter the same in this Section)since1979.As for juvenile probationers,the percentage of15year olds or younger increased,which indicates a lowering trend in age.
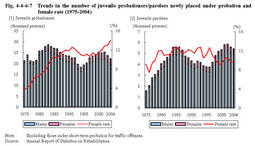
Fig.4-4-6-6 Trends in age distribution of juvenile probationers/parolees newly placed under probation(1979-2004) (2) Sex Fig.4-4-6-7 shows the number of juvenile probationers/parolees newly placed under probation by sex and the female rate over the last30years.
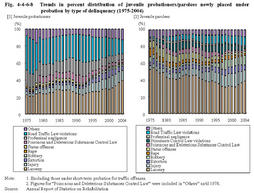
The female rate to overall juvenile probationers was14.0%,and that to over all juvenile parolees was9.7%in2004. Fig.4-4-6-7 Trends in the number of juvenile probationers/parolees newly placed under probation and female rate(1975-2004) (3) Type of delinquency Fig.4-4-6-8[1] shows the percent distribution of juvenile probationers newly placed under probation over the last30years,by type of delinquency.
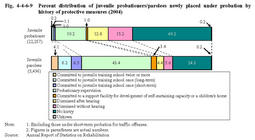
The percentage of larceny and injury has been on a rise,while that of professional negligence and Road Traffic Law violations has been on a declining trend.In2004,larceny was the most frequently committed offense(39.5%),followed by Road Traffic Law violations(16.6%),injury(11.8%),professional negligence(7.1%),and extortion(5.3%) Fig.4-4-6-8[2] shows the percent distribution of juvenile parolees newly placed under probation over the last30years,by type of delinquency. Fig.4-4-6-8 Trends in percent distribution of juvenile probationers/parolees newly placed under probation by type of delinquency(1975-2004) (4) History of protective measures Fig.4-4-6-9 shows a breakdown of juvenile probationers/parolees by history of protective measures.
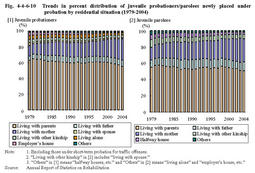
Fig.4-4-6-9 Percent distribution of juvenile probationers/parolees newly placed under probation by history of protective measures(2004) (5) Residential situation Fig.4-4-6-10 shows the percent distribution of juvenile probationers/parolees newly placed under probation since1979,by residential situation.
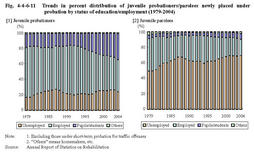
The percentage of juvenile probationers/parolees who live with their mother has been on a rise. Fig.4-4-6-10 Trends in percent distribution of juvenile probationers/parolees newly placed under probation by residential situation(1979-2004) (6) Status of education or employment Fig.4-4-6-11 shows the percent distribution of juvenile probationers/parolees newly placed under probation since1979,by status of education or employment.
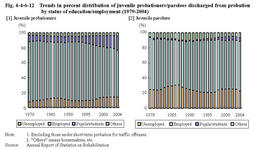
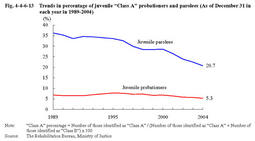
Among juvenile probationers,the percentage of pupils/students has continued to increase since1992,reaching33.6%in2004.In contrast,the percentage of those employed has decreased year by year,down to41.1%in2004. Among juvenile parolees,the percentage of those unemployed has been rather high and was69.4%in2004.In contrast,the percentage of those employed has been low and was20.9%in2004.A decline is observed in the percentage of those who can receive employment right after discharge. Fig.4-4-6-11 Trends in percent distribution of juvenile probationers/parolees newly placed under probation by status of education/employment(1979-2004) It is not necessarily appropriate to compare the juveniles newly placed under probation in2003( Fig.4-4-6-11 )with those discharged from probation in the same year,since these two groups consist of different juveniles.However,comparison revealed that the percentage of those employed was rather higher among those discharged from probation than those newly placed under probation.But in2004,13.8%of juvenile probationers and22.9%of juvenile parolees were discharged without being employed. Fig.4-4-6-12 Trends in percent distribution of juvenile probationers/parolees discharged from probation by status of education/employment(1979-2004) (7) Percentage of Class A in classified treatment system Fig.4-4-6-13 shows the percentage of"Class A"juveniles(the rate of those who were considered to be difficult to treat;see Part2,Chapter5,Section3-4(1) )among overall juvenile probationers/parolees since1989.
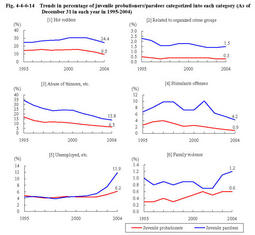
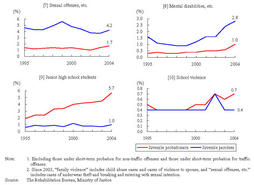
The higher percentage of juvenile"Class A"parolees indicates that juvenile parolees were more likely to have problems that might hinder their rehabilitation. Fig.4-4-6-13 Trends in percentage of juvenile"Class A"probationers and parolees(As of December31in each year in1989-2004) (8) Percentage of each category in categorized treatment system Fig.4-4-6-14 shows the percentage of juvenile probationers/parolees categorized into each category(see Part2,Chapter5,Section3-4(2) )among overall juvenile probationers/parolees over the last10years.
In recent years,the percentage of"unemployed,etc.,""mentally disabled,etc."and"junior high school students"has increased,while that of"abuse of thinners,etc."has decreased. As of December31,the percentage was relatively high for those categorized into"Hot rodders"(9.5%for juvenile probationers and24.4%for juvenile parolees)and"abuse of thinners,etc."(6.5%for juvenile probationers,and13.8%for juvenile parolees). Fig.4-4-6-14 Trends in percentage of juvenile probationers/parolees categorized into each category(As of December31in each year in1995-2004) |