| Previous Next Index Image Index Year Selection | |
|
|
3. Characteristics of juvenile probationers/parolees The characteristics of juvenile probationers(excluding those under short-term probation for traffic offenses;hereinafter the same in this section)and juvenile parolees newly placed under supervision in2003are described below.
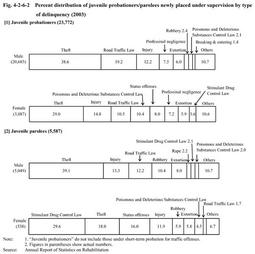
(1) Genderandtypeofdelinquency Fig. 4-2-6-2 shows gender and type of delinquency of juvenile probationers/parolees.By gender,male probationers were20,685,87.0%out of a total of23,772,and male parolees were5,049,90.4%out of5,587,while female probationers were3,087(13.0%)and female parolees were538(9.6%).
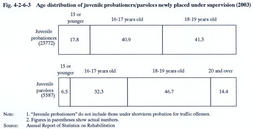
By type of delinquency,as far as juvenile probationers are concerned,theft was the most frequently committed offense by both males and females(38.6%for males and29.0%for females),followed by Road Traffic Law violations and injury in the case of males,while,in the case of females,it was followed by injury,Road Traffic Law violations,and Poisonous and Deleterious Substances Control Law violations.For male parolees,theft had the largest share(39.1%),followed by injury,Road Traffic Law violations,and robbery.Juvenile parolees differed from juvenile probationers in that they were more likely to commit robbery.As for female parolees,Stimulant Drug Control Law violations had the largest share(29.6%),followed by theft,status offense,and injury,showing a large difference from male and female probationers and male parolees. Fig. 4-2-6-2Percent distribution of juvenile probationers/parolees newly placed under supervision by type of delinquency(2003) (2) Age Fig. 4-2-6-3 shows the age distribution of juvenile probationers/parolees.As for juvenile probationers,16-17year olds and18-19year olds had almost the same share,slightly exceeding40%,while the percentage of15year olds or younger was less than20%.For juvenile parolees,18-19year olds had the largest share at46.7%,and20years or older also reached14.4%,while the percentage of16-17year olds was32.3%.In conclusion,juvenile parolees were older than juvenile probationers.
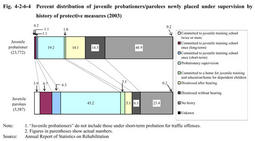
Fig. 4-2-6-3Age distribution of juvenile probationers/parolees newly placed under supervision(2003) (3) History of protective measures Fig. 4-2-6-4 shows a breakdown of juvenile probationers/parolees by history of protective measures.As for juvenile probationers,those without a history of protective measures accounted for48.9%(down1.2points from the previous year),followed by those with probation(19.2%),those dismissed after hearing by a family court(14.1%),and those dismissed without hearing by a family court(14.3%).In contrast,those juvenile parolees without a history of protective measures accounted for23.4%(down0.8points from the previous year).Those who had been placed on probation accounted for43.2%,followed by those sent to juvenile training schools(19.0%),those dismissed after hearing(5.1%),and those dismissed without hearing(6.1%).
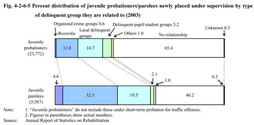
Fig. 4-2-6-4Percent distribution of juvenile probationers/parolees newly placed under supervision by history of protective measures(2003) (4) Relationshipswithdelinquentgroups Fig. 4-2-6-5 shows a breakdown of type of delinquent group to which juvenile probationers/parolees had relationships.Over60%of juvenile probationers had no relationships with delinquent groups.A total of12.8%had relationships with bosozoku,14.7%with local delinquent groups, and 5.2%with delinquent pupil/student groups.On the other hand,juvenile parolees unrelated with delinquent groups accounted for about40%,and the percentages of those related with bosozoku(32.3%)and local delinquent groups(19.5%)were higher,and4.6%had relationships with organized crime groups.In sum,about60%of juvenile parolees had relationships with delinquent groups.
Fig. 4-2-6-5Percent distribution of juvenile probationers/parolees newly placed under supervision by type of delinquent group they are related to(2003) (5) Experience of drugabuse Breaking down of juvenile probationers/parolees newly placed under supervision by experience of drug abuse,88.5%of juvenile probationers had no experience of drug abuse,9.2%had used thinners or other organic solvents,1.1%stimulant drugs,and1.1%cannabis or other drugs.On the other hand,69.9%of juvenile parolees had no experience of drug abuse,20.0%had used thinners or other organic solvents,8.0%stimulant drugs,and1.8%cannabis or other drugs.The percentage of drug abusers is higher among juvenile parolees than among juvenile probationers(Source:Annual Report of Statistics on Rehabilitation).
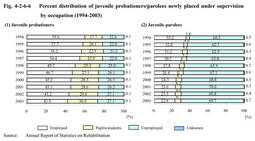
(6) Occupations at the beginning of supervision Fig. 4-2-6-6 shows a breakdown of juvenile probationers/parolees newly placed under supervision by their occupations at the time of beginning of supervision for the past10years.In the long term,the percentage of those employed has decreased and those unemployed and pupils/students have increased for both probationers and parolees.In2003,about40%of probationers were employed,while unemployed and pupils/students accounted for about30%respectively.As for parolees,about70%were unemployed,while slightly more than20%employed and less than10%pupils/students.
Fig. 4-2-6-6Percent distribution of juvenile probationers/parolees newly placed under supervision by occupation(1994-2003) |