| Previous Next Index Image Index Year Selection | |
|
|
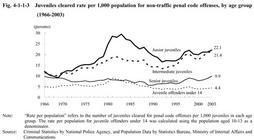
2. Trends in age and gender Fig. 4-1-1-3 shows juveniles cleared rate per1,000population for non-traffic penal code offenses by age group since1966(see Appendix4-2 ).
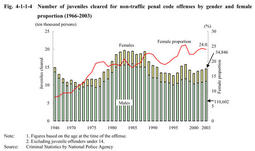
Fig. 4-1-1-3 Juveniles cleared rate per1,000population for non-traffic penal code offenses,by age group(1966-2003) Fig. 4-1-1-4 shows the proportion of females to the total juveniles cleared for non-traffic penal code offenses.The female proportion,which has been on the rise from a long-term perspective,fell by0.4from the previous year to 24.0%in2003. Fig. 4-1-1-4 Number of juveniles cleared for non-traffic penal code offenses by gender and female proportion(1966-2003) |