| Previous Next Index Image Index Year Selection | |
|
|
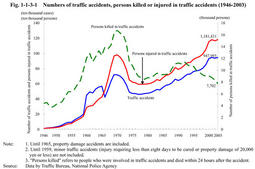
1. Traffic accidents (1) Traffic accidents Fig. 1-1-3-1 shows the number of traffic accidents and the number of persons killed or injured in those accidents since1946.The number of persons killed(those who died within24hours after the accident;hereinafter the same in this section)peaked in1970.It has been on the decline since1993,and decreased by624from the previous year to7,702in2003.The number of persons who died within30days from the accident also decreased by698from the previous year to8,877in2003.The number of traffic accidents was on the rise since1978,setting an all-time high in1993.Since then,it hit a new record high every year until2001,but decreased slightly in2002.However,it increased by11,272from the previous year to947,993,a record high,in2003.The number of persons injured in traffic accidents generally continued to rise after setting an all-time high in1998.It fell slightly in2002,but increased by13,576from the previous year to1,181,431,a record high,in2003(see Appendix1-5 ).
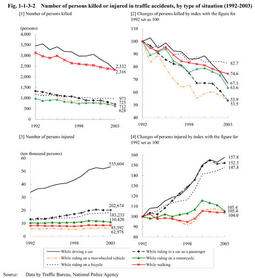
Below,we examine recent traffic accidents in more detail from the perspectives of accident types,age of persons killed or injured,and others. Fig. 1-1-3-1 Numbers of traffic accidents,persons killed or injured in traffic accidents(1946-2003) (2) Number of persons killed or injured by type of situation Fig. 1-1-3-2 shows the changes of persons killed or injured in traffic accidents by type of situation since1992,when persons killed in traffic accidents were the largest in the Heisei era.
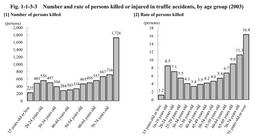
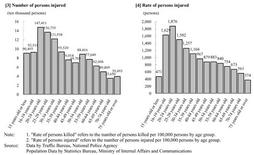
Fig. 1-1-3-2[1] shows the number of persons killed by type of situation.The number of persons killed has continued to decrease in all types of situation.Those killed while driving a car had been the largest until2002,followed by those while walking.In2003,however,those while walking were the largest,followed by those while driving a car. Fig. 1-1-3-2[2] shows the changes of persons killed,using the index of the number in1992as100.It indicates that those killed while riding in a car as a passenger and those while riding on a two-wheeled vehicle dramatically dropped. Fig. 1-1-3-2[3] shows the number of persons injured by type of situation.It indicates that persons injured while driving a car have been the largest every year. Fig. 1-1-3-2[4] shows changes in the number of persons injured,using an index with the figure for1992se t as100.It indicates that those while riding in a car as a passenger and those while riding on a bicycle,and those while driving a car have increased remarkably. Fig. 1-1-3-2 Number of persons killed or injured in traffic accidents,by type of situation(1992-2003) (3) Persons killed or injured by age group Fig. 1-1-3-3 shows the number and rate of persons killed or injured in traffic accidents in2003,by age group. Fig. 1-1-3-3[1] shows the number of persons killed.It indicates that the number of elderly people aged75or over is remarkably large. Fig. 1-1-3-3[2] shows the rate of persons killed per100,000persons.Rate is the lowest for persons aged35-39,gradually becomes higher as it goes into older age groups,and is the highest for those aged75or over.Rate is also high for persons aged16-19,following those aged65-69. Fig. 1-1-3-3[3] shows the number of persons injured by age group.The number of persons injured is the largest for persons aged20-24,and becomes lower as it goes into older age groups. Fig. 1-1-3-3[4] shows the rate of persons injured per100,000persons.Rate is the highest for pers ons aged20-24,with1,876persons,and becomes lower for as it goes into older age groups.
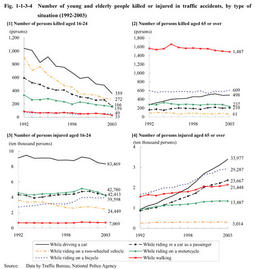
Fig. 1-1-3-3 Number and rate of persons killed or injured in traffic accidents,by age group(2003) (4) Young and elderly people killed or injured,by type of situation Fig. 1-1-3-4 shows the number and changes of persons killed or injured since1992for young people aged16-24and elderly people aged65or over,by type of situation. Fig. 1-1-3-4[1] and Fig. 1-1-3-4[2] show the numbers of young and elderly people killed.Young people killed while driving a car and those while riding on a two-wheeled vehicle fell sharply.Those killed while walking is the smallest among the young,while the largest among the elderly.Those killed while driving a car have been on the rise among the elderly. Fig. 1-1-3-4[3] and Fig. 1-1-3-4[4] show the numbers of young and elderly people injured.Those injured while riding on a two-wheeled vehicle have been on the decline for young people.Elderly people injured have generally been on the rise.In particular,those while driving a car have i ncreased remarkably,and those while riding on a bicycle and while riding in a car as a passenger have also increased remarkably.
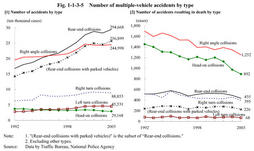
Fig. 1-1-3-4 Number of young and elderly people killed or injured in traffic accidents,by type of situation(1992-2003) (5) Types of traffic accidents Among947,993traffic accidents in2003,accidents between pedestrians and vehicles were84,924(9.0%),and single-vehicle accidents52,998(5.6%)and multiple-vehicle accidents809,918(85.4%),accounting for the majority(Source:Data by Traffic Bureau,National Police Agency). Fig. 1-1-3-5[1] shows the number of multiple-vehicle accidents by type since1992.Right angle collisions had been the largest until1995.However,since1996,rear-end collisions has the largest share and noticeably increased.Rear-end collisions can be divided into two types:collisions with moving vehicles,and a collision to a parked vehicles.The figure indicates that many of the rear-end collisions are collisions with parked vehicles.Of7,456traffic accidents resulting in death in2003,multiple-vehicle accidents has the largest share with3,493(46.8%),followed by accidents between pedestrians and vehicles with2,268(30.4%),single-vehicle accidents with1,644(22.0%),and railroad crossi ng accidents with51(0.7%)(Source:Data by Traffic Bureau,National Police Agency). Fig. 1-1-3-5[2] shows the number of multiple-vehicle accidents resulting in death by type since1992.Right angle collisions and head-on collisions are the most and the second respectively,both of which declined.Rear-end collisions which have increased in total accidents,in particular,those to parked vehicles,have generally remained flat with a relatively small figure in death resulting accidents.
Fig. 1-1-3-5 Number of multiple-vehicle accidents by type |