| Previous Next Index Image Index Year Selection | |
|
|
1. Outline The number of persons newly received by public prosecutors offices for the10most common special law offenses(including violation of ordinances)in2003is as follows:
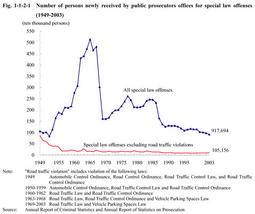
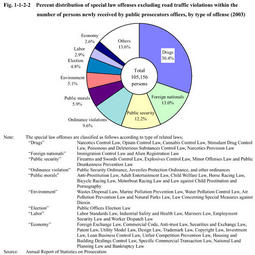
Principal data for2003(special law offenses) Cases(percent distribution)(year-on-year change) [1]Road Traffic Law violation 795,009(86.6%)(-66,134) [2]Stimulant Drug Control Law violation 22,087(2.4%)(-2,714) [3]Vehicle Parking Spaces Law violation 17,529(1.9%)(-3,540) [4]Immigration Control Law violation 13,603(1.5%)(+2,325) [5]Minor Offenses Law violation 7,227(0.8%)(+714) [6]Poisonous and Deleterious Substances Control Law violation 5,704(0.6%)(+183) [7]Firearms and Swords Control Law violation 5,235(0.6%)(+288) [8]Public Offices Election Law violation 5,040(0.5%)(+4,249) [9]Wastes Disposal Law violation 4,855(0.5%)(+514) [10]Road Trucking Vehicle Law violation 3,108(0.3%)(-334) Others 38,297(4.2%) Total 917,694(-58,538) (Source:Annual Report of Statistics on Prosecution) By type of offense,persons newly received for violation of the Road Traffic Law and Vehicle Parking Spaces Law(collectively referred to asroad traffic violation"in this white paper;see Notes)accounted for88.5%of the total persons received for special law offenses and for37.6%of the total including penal code offenses.Road Traffic Law violations do not include violations for which non-penal fines are already paid subject to the traffic violation notification system. Fig. 1-1-2-1 Number of persons newly received by public prosecutors offices for special law offenses(1949-2003) Fig. 1-1-2-2 shows the percent distribution of persons newly received by public prosecutors offices for special law offenses excluding road traffic violations categorized as special law offenses related to drugs,foreign nationals,public security,public morals,environment,elections,labor,economy,other special law violations,and ordinance violations. Fig. 1-1-2-2 Percent distribution of special law offenses excluding road traffic violations within the number of persons newly received by public prosecutors offices,by type of offense(2003) |