| Previous Next Index Image Index Year Selection | |
|
|
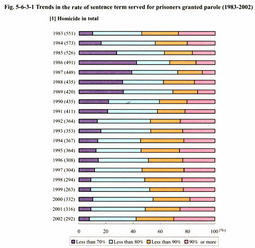
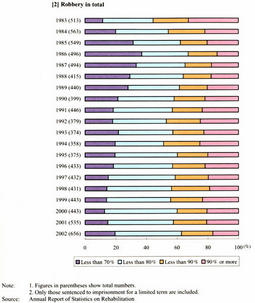
1 Parole Fig. 5-6-3-1 shows the rate of sentence term served for prisoners granted parole among those sentenced to imprisonment with labor for a limited term due to homicide/robbery. Viewing the last 20 years, the percent distribution of prisoners granted parole who served less than 70% of the sentence term decreased by 34.3 points from 42.2% to 7.9% during the period between 1986 and 2002 while that of those who served 80% or more of the sentence term increased by 24.4 points from 33.4% to 57.8%, showing a tendency toward higher rate of sentence term served as a whole. On the other hand, for robbery, the percent distribution of prisoners granted parole who served less than 70% of the sentence term decreased by 17.6 points from 37.1% to 19.5% during the period between 1986 and 2002. The rate of the sentence term served has been high in the last 10 years, but there remains a tendency for about 60% of prisoners granted parole to be released on parole after serving less than 80% of the sentence term.
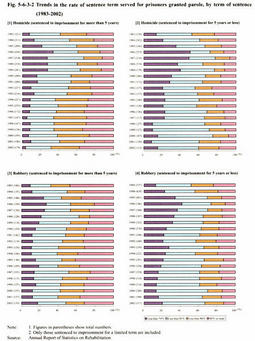
Fig. 5-6-3-2 shows the above-mentioned rate of sentence term served for prisoners granted parole, by sentence term (divided into those sentenced to imprisonment for more than 5 years and those for 5 years or less). Viewing prisoners sentenced to imprisonment for more than 5 years for homicide, the percent distribution of prisoners granted parole who served less than 70% of the sentence term declined by 30.1 points, from 33.5% to 3.4%, during the period between 1986 and 2002, while the percent distribution of those who served 80% or more of the sentence term increased by 29.7 points, from 39.0% to 68.7%, during the same period, showing a tendency toward a higher rate of sentence term served. For prisoners sentenced to imprisonment for 5 years or less, the percent distribution of those granted parole who served 80% or more of the sentence term has shown no upward tendency. However, if we focus on prisoners granted parole who served less than 70% of the sentence term, we see the number declined by 35.2 points from 50.2% to 15.0% during the period between 1986 and 2002. Thus, the rate of sentence term served is considered to have been increasing as a whole. There is also a tendency for the rate to be higher for those sentenced to imprisonment for more than 5 years than those sentenced for 5 years or less. Next, viewing prisoners sentenced to imprisonment for more than 5 years due to robbery, the percent distribution of those granted parole who served less than 70% of the sentence term declined by 9.4 points from 26.7% to 17.3% during the period between 1986 and 2002, indicating that the rate of sentence term served has become slightly higher. Viewing prisoners granted parole who served less than 80% of the term of execution of sentence, the percent distribution has remained around 40% over the last 10 years, showing no large changes in this point. In the case of those sentenced to imprisonment for 5 years or less, the percent distribution of those granted parole who served 80% or more of the sentence term does not show any upward trend. However, if we focus on those who served less than 70% of the term of execution of sentence, we see the percent distribution declined by 21.5 points from 41.6% to 20.1 % during the period between 1986 and 2002. Thus, the rate of sentence term served can be considered to be increasing as a whole. As with homicide, there is a tendency for the rate to be higher for those sentenced to imprisonment for more than 5 years than those sentenced to imprisonment for 5 years or less. Incidentally, the number of prisoners granted parole after serving less than 80% of the sentence term has been increasing since 2001. Fig. 5-6-3-1 Trends in the rate of sentence term served for prisoners granted parole (1983-2002) Fig. 5-6-3-2 Trends in the rate of sentence term served for prisoners granted parole, by term of sentence (1983-2002) |