| Previous Next Index Image Index Year Selection | |
|
|
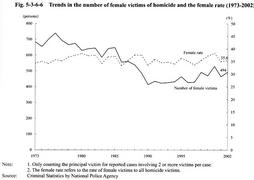
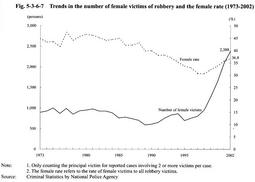
2 Changes in victims, by gender and age group (1) Trends by victim group (a) Trends in female victims Fig. 5-3-6-6 and Fig. 5-3-6-7 show the trends in the number of female victims of homicide and robbery since 1973 and the rate of females to all victims. As for homicide, the number of female victims has been moving sideways or rising slightly after showing a declining trend from 1975 to 1990 whereas the female rate has remained almost flat over 30%, without fluctuation. As for robbery, on the other hand, the number of female victims has been rising after moving sideways or declining slightly until 1989. It has been rising sharply since 1996, increasing 3.4-fold from 1995 to 2002. The female rate continued to decline from 1973 to 1998, but then started to rise, up 6.2 points in just 4 years.
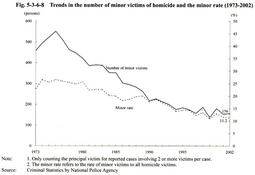
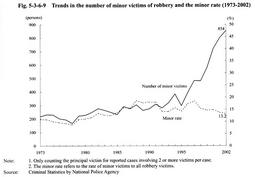
With respect to the population trends by gender, the female population has been rising gradually but only increasing by 17.5% from 1973 and by 1.9% from 1995 to 2002. This means that the sharp increase in the number of female victims of robbery has not only resulted from the increase in opportunities for females to be victimized due to the increase in the female population but also from the sharp rise in the total number of robbery cases. However, in light of the fact that the female rate has increased by 6.2 points in the last 4 years, it may follow that females are being targeted for robbery more frequently and therefore attention should be paid to the future trend. Fig. 5-3-6-6 Trends in the number of female victims of homicide and the female rate (1973-2002) Fig. 5-3-6-7 Trends in the number of female victims of robbery and the female rate (1973-2002) (b) Trends in minor victims Fig. 5-3-6-8 and Fig. 5-3-6-9 show the trends in the number of minor victims of homicide and robbery since 1973 and the rate of minors to all victims. As for homicide, the number of minor victims has been on a declining trend after peaking in 1976, falling below 30% of the peak number in 2002. The minor rate has also been declining after peaking in 1976 at 26.6%0, falling to 11.2% in 2002. As for robbery, on the other hand, the number of minor victims has been rising gradually since 1979 and rapidly since 1996, increasing 2.9-fold from 1995 to 2002. The minor rate continued to rise since 1979, but subsequently, it has been moving sideways or declining since 1989.
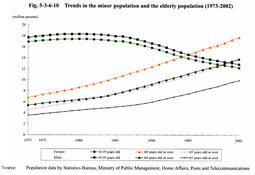
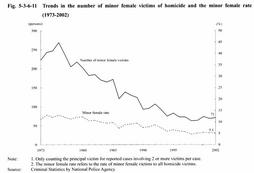
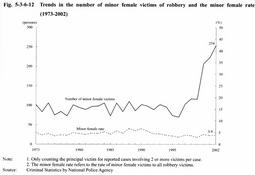
Fig. 5-3-6-10 shows the trends in the minor population and the elderly population. The minor population has been dropping sharply after peaking in 1980, decreasing by 30% from the peak time and by 12.3% from 1995 to 2002. As mentioned in Chapter 2, Section 2-2 , the decline in the number of minor victims of homicide may result from the decline in infanticides and the drop in the minor population whereas the rise in the number of minor victims of robbery, particularly since 1996, seems to be different from the population trend. However, in light of the fact that the rate of minors to all robbery victims seems to have already peaked, such difference may only indicate the increase in the number of minor victims in line with the increase in the total number of robbery cases. Fig. 5-3-6-8 Trends in the number of minor victims of homicide and the minor rate (1973-2002) Fig. 5-3-6-9 Trends in the number of minor victims of robbery and the minor rate (1973-2002) Fig. 5-3-6-10 Trends in the minor population and the elderly population (1973-2002) (c) Trends in minor female victims Fig. 5-3-6-11 and Fig. 5-3-6-12 show the trends in the number of minor female victims of homicide and robbery since 1973 and the rate of minor females to all victims. As for homicide, the number of minor female victims has been on a declining trend after peaking in 1976, falling to 1/4 of the peak number in 2002. The minor female rate has also been on a declining trend after peaking in 1974 and 1976 at 13.0%, falling to 5.1 % in 2002. As for robbery, on the other hand, the number of minor female victims moved sideways with some fluctuation until 1986 but started to rise sharply in 1997, increasing 3.6-fold from 1996 to 2002. The minor female rate has been moving sideways and declining slightly since 1991. The minor female population has been declining (see Fig. 5-3-6-10 ), decreasing by 10.3% from 1996 to 2002. Consequently, the rapid rise in the number of victims in recent few years seems to be resulting from the rapid rise in the number of minor female victims in line with the increase in the total number of robbery cases. However, in light of the fact that the rate of minor females to all robbery victims has been moving sideways, it is difficult to conclude that minor females are particularly targeted more frequently for robbery.
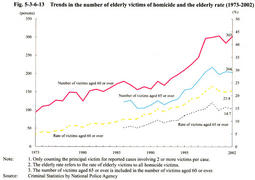
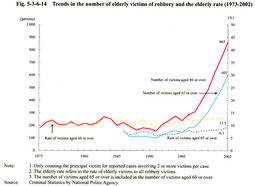
Fig. 5-3-6-11 Trends in the number of minor female victims of homicide and the minor female rate (1973-2002) Fig. 5-3-6-12 Trends in the number of minor female victims of robbery and the minor female rate (1973-2002) (d) Trends in elderly victims Fig. 5-3-6-13 and Fig. 5-3-6-14 show the trends in the number of elderly victims (aged 60 or over) of homicide and robbery since 1973 and the rate of elderly people to all victims. As for homicide, the number of elderly victims has been rising, and particularly since 1993 it has been showing an intensified upward trend, increasing 3.2-fold from 1973 to 2002. The elderly rate has also been rising, up 17.1 points from 1973 to 2002. As for robbery, on the other hand, the number of elderly victims moved sideways from 1973 until 1991 but then started to rise significantly, increasing 5.5-fold from 1991 to 2002. The elderly rate has remained almost flat, fluctuating within a range from 8.8% to 13.3%. As shown in Fig. 5-3-6-10, the elderly population has been rising, increasing sharply 2.6-fold from 1973 and 1.4-fold from 1991 to 2002. In light of the increase in the number of elderly victims of homicide as well as the rise in the rate of elderly people to all homicide victims in line with the increase in the elderly population, it may follow that elderly people have been targeted for homicide more frequently. The sharp rise in the number of elderly victims of robbery seems to have been going along with the sharp rise in the total number of robbery cases. However, with signs of an upward trend seen in the elderly rate, attention should be paid to the future trend, but at the present time, it is not appropriate to go so far as to say that elderly people are being particularly targeted for robbery more frequently.
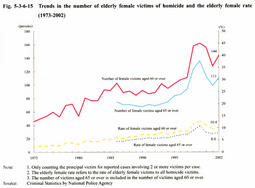
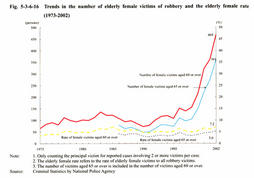
Fig. 5-3-6-13 Trends in the number of elderly victims of homicide and the elderly rate (1973-2002) Fig. 5-3-6-14 Trends in the number of elderly victims of robbery and the elderly rate (1973-2002) (e) Trends in elderly female victims Fig. 5-3-6-15 and Fig. 5-3-6-16 show the trends in the number of elderly female victims of homicide and robbery since 1973 and the rate of elderly females to all victims. As for homicide, the number of elderly female victims has been rising, increasing 3.1-fold from 1973 to 2002. The elderly female rate has also been rising slightly, up 8.1 points from 1973 to 2002. As for robbery, on the other hand, the number of elderly female victims moved sideways or declined since 1973 until 1990 but then started to rise sharply, increasing 6.4-fold from 1990 to 2002. The elderly female rate has remained almost flat, fluctuating within the range from 3.3% to 7.2%. The elderly female population has been rising (see Fig. 5-3-6-10 ), increasing by 2.6-fold from 1973 and 1.4-fold from 1990 to 2002. The number of elderly female victims of homicide has been increasing in line with the rise in the elderly female population whereas the number of elderly female victims of robbery has been rising further significantly in recent years. In light of the fact that the rate of elderly females to all robbery victims has been moving sideways, it is difficult to conclude that elderly females are particularly targeted for robbery more frequently, but attention should be paid to the future trend.
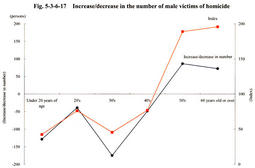
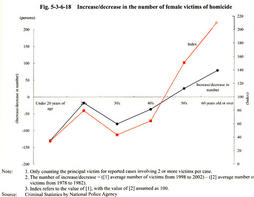
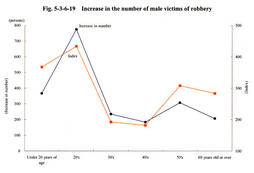
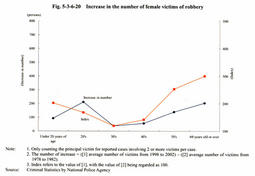
Fig. 5-3-6-15 Trends in the number of elderly female victims of homicide and the elderly female rate (1973-2002) Fig. 5-3-6-16 Trends in the number of elderly female victims of robbery and the elderly female rate (1973-2002) (2) Changes in victims over 20 years, by age group In addition to the trends in female, minor, and elderly victims that have been overviewed above, the trends in male victims and victims in their 20s to 50s are also examined in this subsection. Fig. 5-3-6-17 , Fig. 5-3-2-18 , Fig. 5-3-2-19 , Fig. 5-3-6-20 show the increase/decrease in the number of victims over the last 20 years (through comparison between the average number of victims during the period from 1978 to 1982 and the average number of victims during the period from 1998 to 2002), by gender and by age group.
As for homicide victims, the rate of increase in victims aged 50 or over, and in particular, in those aged 60 or over, was remarkable among both male victims and female victims, almost doubling in 20 years. A significant drop was seen both in the number and rate of victims under 50. Among female victims, the rate of increase in victims aged 60 or over was about 2.1, remarkably higher than the rate in other age groups. Thus, as for homicide, elderly people of both genders are being targeted more frequently than 20 years ago. As for robbery victims, there is a significant difference in trends between male victims and female victims. As for male victims, the number of victims increased in all age groups. In particular, compared with 20 years ago, the increase in the number of victims in their 20s is remarkable, with the annual average increase in the actual number being 774.6 persons and the rate of increase being 4.3. Following this age group, the number of victims under 20 also rose sharply, with the rate of increase being 3.7. As for female victims, on the other hand, the increase in the number of victims was largest among victims in their 20s, followed by those aged 60 or over and those in their 50s. The rate of increase was highest among victims aged 60 or over at 3.0, followed by those in their 50s at 2.5 and those under 20 at 2.0, indicating a sharp rise in victims aged 50 or over and in minor victims. Thus, as for robbery, compared with 20 years ago, young people among male victims and elderly people and minors among female victims have increased more significantly than victims in other age groups. Fig. 5-3-6-17 Increase/decrease in the number of male victims of homicide Fig. 5-3-6-18 Increase/decrease in the number of female victims of homicide Fig. 5-3-6-19 Increase in the number of male victims of robbery Fig. 5-3-6-20 Increase in the number of female victims of robbery |