| Previous Next Index Image Index Year Selection | |
|
|
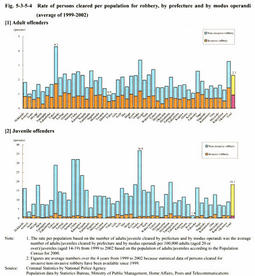
2 Regional trends in juvenile robbery offenders-Compared with adult robbery offenders- (1) Trends in juvenile robbery offenders over the last 4 years The number of juvenile robbery offenders has been swelling recently. Fig. 5-3-5-4 shows the rate per population based on the number of persons cleared (the average number of persons cleared per 100,000 persons by age group) for robbery over the 4 years from 1999 to 2002, by prefecture, adult/juvenile offenders, and invasive/non-invasive robbery.
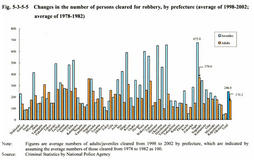
As for adult robbery offenders, there was a gap among prefectures, with the national average rate at 2.3, the highest rate at 4.3, and the lowest at 0.9. The rate per population was remarkably high in Tokyo, followed by Osaka, and the rate was also high in other prefectures containing or surrounding large cities. According to the categorization of invasive robbery and non-invasive robbery, adult offenders committed invasive robbery as frequently as non-invasive robbery, especially in Tokyo. As for juvenile robbery offenders, there was a larger gap among prefectures than in the case of adult offenders, with the national average rate at 18.3, the highest rate at 36.8, and the lowest at 1.4. The crime rate was remarkably high in Osaka, followed by Tokyo and its neighboring prefectures such as Chiba, Saitama, and Kanagawa. Thus, the distribution of robbery cases committed by juvenile offenders was somewhat different from that of cases committed by adult offenders. Unlike adult offenders, the number of juvenile offenders who committed invasive robbery was small in all prefectures and the majority of juvenile robbery offenders committed street robbery or other types of non-invasive robbery. These trends suggest that juveniles have more opportunities to commit street robbery while hanging around at night in prefectures containing large cities where a lot of stores and restaurants are open and many people are hanging around at night, such as Tokyo, Kanagawa, Saitama, and Chiba in the Kanto area and Osaka in the Kansai area. Fig. 5-3-5-4 Rate of persons cleared per population for robbery, by prefecture and by modus operandi (average of 1999-2002) (2) Regional changes over the 20 years in the rate of increase in the number of juvenile robbery offenders cleared Fig. 5-3-5-5 shows the "average number of adults/juveniles cleared for robbery over the 5 years from 1998 to 2002", which is indicated by regarding the "average number of adults/juveniles cleared for robbery over the 5 years from 1978 to 1982" as 100.
As for adult robbery offenders, there was a gap among prefectures, with the national average rate at 170.2, the highest rate at 370.6, and the lowest at 53.4. The rate of increase was relatively low in Tokyo and Osaka, and it was rather high in prefectures around Tokyo, such as Yamanashi, Tochigi, Chiba, Gunma, Ibaraki, and Saitama, as well as prefectures around Osaka, such as Wakayama, Shiga, and Nara. The rate was also high in Saga. Thus, there is a doughnut phenomenon in the Tokyo metropolitan area in the rate of increase in the number of adults cleared, and robbery cases are gradually spreading from urban areas to suburban areas or local areas. As for juvenile robbery offenders, there was a significant gap among prefectures with respect to the rate of increase in the number of juveniles cleared, with the national average rate at 246.0, the highest rate at 675.0, and the lowest at 44.2, but the rate of increase for juveniles was generally higher than that for adults. The rate of increase was high not only in prefectures around Tokyo such as Chiba, Ibaraki, and Saitama, and prefectures around Osaka, such as Nara, Shiga, and Wakayama, but also in prefectures containing major cities in local areas, such as Hiroshima, Okayama, and Miyagi. In addition to these prefectures where there was rapid increase in population as bed towns, the rate of increase was also high in Saga and Shimane, which had been safe prefectures in the past. Fig. 5-3-5-5 Changes in the number of persons cleared for robbery, by prefecture (average of 1998-2002; average of 1978-1982) |