| Previous Next Index Image Index Year Selection | |
|
|
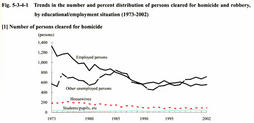
1 Increase in the number of heinous offenders out of employment Fig. 5-3-4-1 shows the number and percent distribution of persons cleared for homicide and robbery since 1973, by educational/employment situation. Among persons cleared for homicide, both the number and percentage of employed persons were larger than those of unemployed persons other than housewives and students/pupils from 1973 until 1984. However, the number and percentage of employed persons and those of unemployed persons came closer to each other from 1985 to 1988. Since 1989, the number and percentage of employed persons have remained flat whereas those of unemployed persons have been rising slightly.
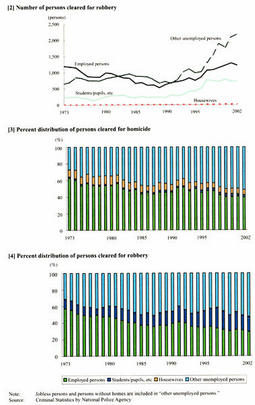
Among persons cleared for robbery, the number and percentage of employed persons were larger than those of unemployed persons until 1982. Subsequently, the number and percentage of unemployed persons exceeded those of employed persons, and since 1992, the gap between the two has been widening due to a sharp rise in the number and percentage of unemployed persons, though an upward trend has also been seen in the number and percentage of employed persons. From 1991 to 2002, the number and percentage of unemployed persons increased 3.3-fold and by 12.6 points whereas the number and percentage of employed persons decreased 1.8-fold and by 12.0 points. The number and percentage of students/pupils remained flat until 1993 but they have been rising significantly after that year, increasing 2.3-fold and by 2.4 points from 1993 to 2002. Fig. 5-3-4-1 Trends in the number and percent distribution of persons cleared for homicide and robbery, by educational/employment situation (1973-2002) |