| Previous Next Index Image Index Year Selection | |
|
|
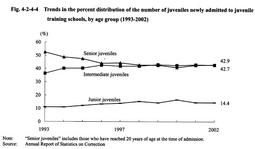
3 Characteristics of newly admitted juveniles (1) Age at time of admission Fig. 4-2-4-4 shows the trends in the percent distribution of juveniles newly admitted for 10 years from 1993, by age group. The percentage of senior juveniles had a majority in 1993 but has slowly declined thereafter, and difference between the percentage of senior juveniles and that of intermediate juveniles, which has been generally on an upward trend, has become smaller. The percentage of intermediate juveniles had slightly exceeded that of senior juveniles between 1999 and 2001, but the situation reverted again in 2002 when the percentage of senior juveniles returned to being slightly over that of intermediate juveniles. The percentage of junior juveniles had mostly been on an upward trend until 2000, but it declined from the previous year in 2001 and was within the range of 14% or over but below 15% in 2002 as with the previous year.
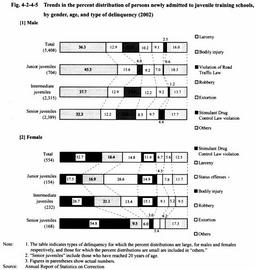
Fig. 4-2-4-4 Trends in the percent distribution of the number of juveniles newly admitted to juvenile training schools, by age group (1993-2002) (2) Type of delinquency Fig. 4-2-4-5 shows the percent distribution of juveniles newly admitted in 2002 by type of delinquency, by gender and age group. By gender, the percent distribution of larceny (36.3%) was largest for males, followed by Road Traffic Law violations (12.9%), bodily injury (12.9%), robbery (10.2%), extortion (9.1%), and Stimulant Drug Control Law violations (2.5%). Compared with the previous year, the percentage of larceny increased, and robbery, which ranked 5th in the previous year, exceeded extortion and came out 4th. For females, the percent distribution of Stimulant Drug Control Law violations (32.7%) was highest, followed by larceny (16.4%), status offense (14.8%), bodily injury (11.4%), robbery (6.7%), and extortion (5.6%). Compared with the previous year, the percentage of Stimulant Drug Control Law violations increased, and robbery, which ranked 7th following Poisonous and Deleterious Substances Control Law violations in the previous year, came out 5th (see Appendix 4-12 ).
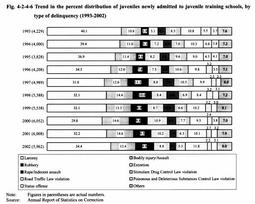
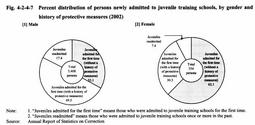
By gender and age group, for males, the percentages of larceny and bodily injury become lower while those of Road Traffic Law violations, extortion, and Stimulant Drug Control Law violations become higher, as juveniles get older. Contrary to this, for females, the percentage of Stimulant Drug Control Law violations becomes higher as juveniles get older, and it accounts for a majority for senior juveniles. However, the percentages of status offenses and extortion become lower as juveniles get older. For robbery, the percentage for intermediate juveniles is high for both males and females. Fig. 4-2-4-5 Trends in the percent distribution of persons newly admitted to juvenile training schools, by gender, age, and type of delinquency (2002) Fig. 4-2-4-6 Trend in the percent distribution of juveniles newly admitted to juvenile training schools, by type of delinquency (1993-2002) (3) History of protective measures and history of disposition Fig. 4-2-4-7 shows the percent distribution of juveniles newly admitted to juvenile training schools in 2002 by history of protective measures, by gender. Those who were admitted to juvenile training schools for the first time accounted for 82.6% for males and 92.6% for females. Of them, those with a history of protective measures accounted for 49.5% for males and 30.5% for females, while those without such history accounted for 33.1 % for males and 62.1 % for females. For males, juveniles who were admitted to juvenile training schools for the first time with a history of protective measures accounted for almost 50%, while for females, juveniles who were admitted to juvenile training schools for the first time without a history of protective measures accounted for more than 60%.
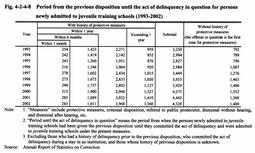
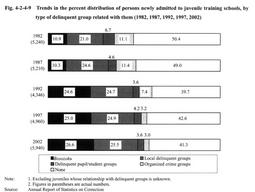
Fig. 4-2-4-7 Percent distribution of persons newly admitted to juvenile training schools, by gender and history of protective measures (2002) Fig. 4-2-4-8 Period from the previous disposition until the act of delinquency in question for persons newly admitted to juvenile training schools (1993-2002) (4) Relationship with delinquent groups and accomplices Fig. 4-2-4-9 shows the trends in the percent distribution of juveniles newly admitted every 5 years since 1982, by type of delinquent group related with them. Around half of juveniles newly admitted had relationship with delinquent groups until 1987 but has remained around 60% since 1992. Examining the breakdown thereof, the percentage for bosozoku has increased and that for local delinquent groups has also been on an upward trend, while that for organized crime groups has been declining.
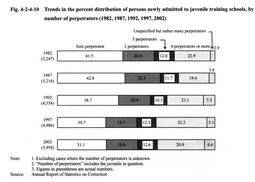
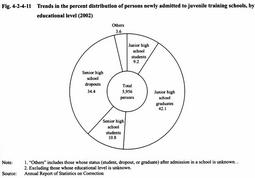
Among those newly admitted in 2002, 58.7% had a relationship with delinquent groups. Examining the details thereof, the percentage of bosozoku had the largest share (26.6%), followed by local delinquent groups (25.5%), delinquent pupil/student groups (3.6%), and organized crime groups (3.0%). Fig. 4-2-4-9 Trends in the percent distribution of persons newly admitted to juvenile training schools, by type of delinquent group related with them (1982, 1987, 1992, 1997, 2002) Among those newly admitted in 2002, the percentage of those who acted alone in committing offenses was 31.1 % while that of those who committed offenses with others was 68.9%. Juveniles who committed offenses in a group of four or more accounted for 29.9% and those who committed offenses in a group containing an unspecified but rather large number of juveniles accounted for 6.6%. Those who committed offenses with friends were the most frequent, accounting for 39.4%, followed by delinquent groups (22.2%) (Source: Annual Report of Statistics on Correction). Fig. 4-2-4-10 Trends in the percent distribution of persons newly admitted to juvenile training schools, by number of perpetrators (1982, 1987, 1992, 1997, 2002) (5) Educational level and status of employment Fig. 4-2-4-11 shows the percent distribution of persons newly admitted to juvenile training schools in 2002, by educational level. The percentage of junior high school graduates was highest with 42.1 %, followed by senior high school dropouts (34.4%), senior high school students (10.8%), and junior high school students (9.2%).
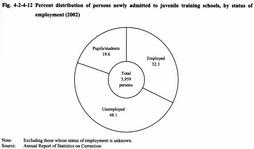
The number of senior high school students has been on an upward trend since 1992. Assuming the number in 1992 as 100 for index purposes, 403 is applied to 2002. Fig. 4-2-4-11 Trends in the percent distribution of persons newly admitted to juvenile training schools, by educational level (2002) Fig. 4-2-4-12 Percent distribution of persons newly admitted to juvenile training schools, by status of employment (2002) (6) Guardians and situation of cohabitation Among juveniles newly admitted in 2002, 48.7% (49.6% for males and 391.7% for females) had guardians who were their biological parents. The total percentage declined by 1.5 points from the previous year (Source: Annual Report of Statistics on Correction).
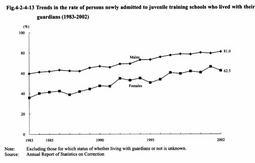
Fig. 4-2-4-13 shows the trends in the rate of those newly admitted since 1983 who lived with their guardians. The rate of juveniles living with their guardians is on an upward trend for both males and females. In 2002, 81.0% males newly admitted and 62.5 % females newly admitted lived with their guardians. Fig.4-2-4-13 Trends in the rate of persons newly admitted to juvenile training schools who lived with their guardians (1983-2002) (7) Drug abuse Viewing drug-related offenses among types of delinquency committed by juveniles newly admitted in 2002, for males, Stimulant Drug Control Law violations accounted for 2.5% while Poisonous and Deleterious Substances Control Law violations accounted for 1.9%. For females, Stimulant Drug Control Law violations accounted for 32.7% while Poisonous and Deleterious Substances Control Law violations accounted for 5.1%. The percentage of drug-related offenses is high among females (see Appendix 4-12 ).
Viewing the percentage of juveniles newly admitted to juvenile training schools in 2002 who were under the influence of drugs at the time of delinquency regardless of type of delinquency, the percentage of those under the influence of drugs declined by 1.6 points from the previous year to 19.2%. By gender, the percentage for males was 16.2% while that for females was 48.7%. By type of drug, for males, organic solvents were most frequently used (11.2%), followed by stimulant drugs (3.4%). For females, stimulant drugs were most frequently used (34.1 %), followed by organic solvents (14.1 %) (Source: Annual Report of Statistics on Correction). (8) Foreign juveniles Of those newly admitted to juvenile training schools in 2002, 42 juveniles (42 males) were placed in the living guidance course (G2) as foreign nationals who need treatment programs different from those for Japanese nationals. Such figures showed a decrease of 3 persons from the previous year. By nationality, Brazilians (38 persons) had the largest share. By type of delinquency, larceny accounted for the largest share (26 persons, 18 persons in the previous year), followed by robbery (7 persons, 19 persons in the previous year). Compared to the previous year, larceny increased while robbery decreased. By the history of protective measures, those who had received probationary supervision accounted for 14 persons, and those who had never received it accounted for 28. Those who had been committed to juvenile training schools accounted for 1 person while those who had never been committed accounted for 41. Viewing relationship with delinquent groups and abuse of drugs, those who had relationships with local delinquent groups came to 15 persons. Those who were involved with stimulant drugs came to 8 persons, and those who were involved with cannabis came to 2 persons (Source: Annual Report of Statistics on Correction).
|