| Previous Next Index Image Index Year Selection | |
|
|
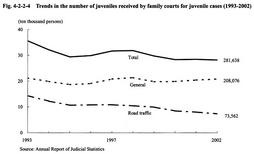
2 Juvenile hearing Fig. 4-2-2-4 shows the trends in the number of persons received by family courts for juvenile cases in the last 10 years, by type of case, general cases and road traffic cases (juvenile cases related to road traffic violations).
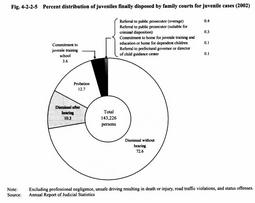
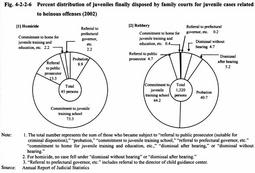
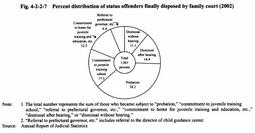
The number of juveniles received in 2002 increased for general cases while it decreased for road traffic cases. Therefore, the total number decreased by 2,698 persons (0.9%) to 281,638. Fig. 4-2-2-4 Trends in the number of juveniles received by family courts for juvenile cases (1993-2002) Fig. 4-2-2-5 Percent distribution of juveniles finally disposed by family courts for juvenile cases (2002) Fig. 4-2-2-6 shows the details of final disposal of juvenile cases related to homicide and robbery by family courts in 2002. Compared with the details of the final disposal of juvenile cases excluding professional negligence, unsafe driving resulting in death or injury, road traffic violations and status offenses, the percent distributions of both referral to public prosecutor and commitment to juvenile training school were much higher for homicide. As for the details of final disposal of juvenile cases related to robbery, the percent distributions of probation and commitment to juvenile training school accounted for over 80%. Compared with the details of the final disposal of juvenile cases excluding professional negligence, unsafe driving resulting in death or injury, road traffic violations and status offenses, the percent distributions of referral to public prosecutor, commitment to juvenile training school and probation were higher for robbery. Fig. 4-2-2-6 Percent distribution of juveniles finally disposed by family courts for juvenile cases related to heinous offenses (2002) Fig. 4-2-2-7 Percent distribution of status offenders finally disposed by family court (2002) |