| Previous Next Index Image Index Year Selection | |
|
|
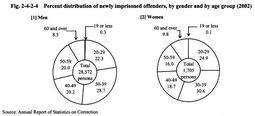
3 Characteristics of newly imprisoned offenders (1) Age Fig. 2-4-2-4 shows the percent distribution of newly imprisoned offenders in 2002 by gender and by age group.
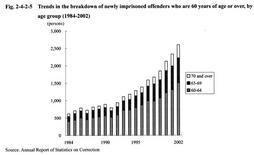
Fig. 2-4-2-4 Percent distribution of newly imprisoned offenders, by gender and by age group (2002) Fig. 2-4-2-5 shows the trends in the breakdown of newly imprisoned offenders who were 60 years of age or over, by age group. Among inmates as of December 31, 2002, 5,870 were 60 years of age or over (1,039 of which were 70 years of age or older), accounting for 10.3% of all inmates. Fig. 2-4-2-5 Trends in the breakdown of newly imprisoned offenders who are 60 years of age or over, by age group (1984-2002) (2) Type of offense Of offenses committed by those newly imprisoned in 2002, the following 5 offenses had high percentages for male inmates: (1) larceny (27.4%), (2) Stimulant Drug Control Law violation (22.2%), (3) fraud (7.1%), (4) Road Traffic Law violation (6.8%), and (5) bodily injury (6.3%). The following 5 offenses had high percentages for female inmates, (1) Stimulant Drug Control Law violation (41.8%), (2) larceny (22.2%), (3) fraud (8.4%), (4) homicide (4.3%), and (5) Road Traffic Law violation (3.7%) (see Appendix 2-7 ).
For male inmates, larceny accounted for the highest percentage following the previous year, followed by Stimulant Drug Control Law violation. This trend has continued since 1998. For female inmates, the percentage for Stimulant Drug Control Law violation exceeded that for larceny in 1978 and has been the highest since then. The percentage for Stimulant Drug Control Law violation reached a majority (50.5%) of the total in 1981, and continued until 1997. After that, the percentage for Stimulant Drug Control Law violation has been on a decreasing trend and declined by 4.6 points from the previous year in 2002. (3) Type of sentence and term of imprisonment By type of sentence given to those newly imprisoned in 2002, 99.1% (30,003 inmates) were sentenced to imprisonment with labor, and the rest of them were by imprisonment without labor (0.8%, 230 inmates), penal detention (0.1%, 42 inmates) and death penalty (executed) (0.01%, 2 inmates).
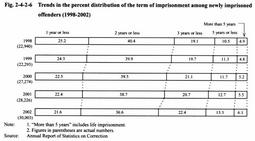
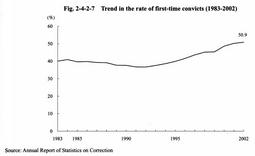
Fig. 2-4-2-6 shows the percent distribution of newly imprisoned offenders sentenced to imprisonment with labor during the period from 1998 to 2002, by the term of imprisonment. The percentage of imprisonment for more than 1 year but 2 years or less were highest for all years, but the percentage of more than 2 years has gradually increased. For the trend in the number of inmates serving sentence of imprisonment with labor at the end of the year by term of imprisonment, see Appendix 2-11 . Fig. 2-4-2-6 Trends in the percent distribution of the term of imprisonment among newly imprisoned offenders (1998-2002) (4) Trend in the rate of first-time convicts Fig 2-4-2-7 shows the trend in the rate of first-time convicts (persons imprisoned to penal institutions for the first time) in all newly imprisoned offenders. In 1993, the rate of first-time convicts was 37.6%, but it exceeded a half of the total (50.2%) in 2001 and further rose to 50.9% in 2002.
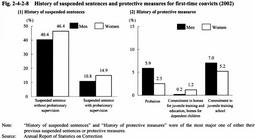
Fig. 2-4-2-7 Trend in the rate of first-time convicts (1983-2002) (5) History of suspended sentences and protective measures for first-time convicts Fig. 2-4-2-8 shows a breakdown of the 15,402 first-time convicts who were newly imprisoned in 2002, according to their histories of suspended sentences and protective measures.
Fig. 2-4-2-8 History of suspended sentences and protective measures for first-time convicts (2002) (6) Frequency of imprisonment Of all offenders newly imprisoned in 2002, repeat convicts (newly imprisoned offenders who had previously been imprisoned once or more) accounted for 49.1%-50.2% for males and 30.4% for females. By type of offense, repeat convicts were most frequently found in those imprisoned for larceny for males (31.2%) and Stimulant Drug Control Law violations for females (51.4%). Those inmates who had previously been imprisoned 4 times or more was 5,803, accounting for 19.2% of the total, and such new inmates accounted for 35.1% of those imprisoned for Physical Violence Law violations, 32.0% of those imprisoned for intimidation, and 31.2% of those imprisoned for breaking and entering (see Appendixes 2-8 and 2-9 ).
|