| Previous Next Index Image Index Year Selection | |
|
|
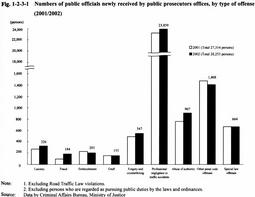
1 Overview Fig. 1-2-3-1 shows the number of public officials newly received by public prosecutors offices in 2001 and 2002, by type of offense. In 2002, the total number of public officials received increased by 939 (3.4%) from the previous year to 28,253. By type of offense, professional negligence in traffic accidents accounted for the overwhelming majority (84.4% of the total), followed by abuse of authority, forgery and counterfeiting, larceny, and embezzlement.
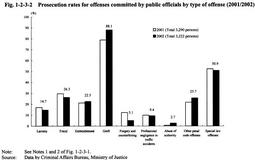
Fig. 1-2-3-1 Numbers of public officials newly received by public prosecutors offices, by type of offense (2001/2002) Fig. 1-2-3-2 Prosecution rates for offenses committed by public officials by type of offense (2001/2002) |