| Previous Next Index Image Index Year Selection | |
|
|
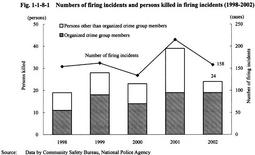
1 Trends in firearm offenses (1) Firing incidents Fig. 1-1-8-1 shows the number of firing incidents and the number of persons killed in these incidents over the last 5 years (in this section, firearms include handguns, rifles, machine guns, cannons, and shotguns as well as other loaders and air guns with the function of projecting metal bullets). In 2002, the number of firing incidents decreased from 215 in the previous year to 158, and the number of persons killed also decreased from 39 in the previous year to 24. Among 24 persons killed, 19 persons were organized crime group members (including regular members and quasi-members of organized crime groups; hereinafter the same in this section) and the persons killed other than organized crime group members decreased from the previous year (20 persons).
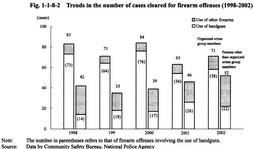
Fig. 1-1-8-1 Numbers of firing incidents and persons killed in firing incidents (1998-2002) (2) Clearance of cases involving the use of handguns Fig. 1-1-8-2 shows the number of cleared cases for firearm offenses and the number of cleared cases involving the use of handguns over the last 5 years in comparison, between the cases committed by organized crime group members and those by persons other than them.
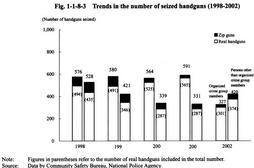
In 2002, the number of cleared cases for firearm offenses increased by 14 from the previous year to 123, of which 52 cases (42.3%) were committed by persons other than organized crime group members. This rate was almost same as that of the previous year (42.2%). By type of firearms used, the use of handguns was the largest at 80, accounting for about 65% of the total. Fig. 1-1-8-2 Trends in the number of cases cleared for firearm offenses (1998-2002) (3) Trends of seizure of handguns Fig. 1-1-8-3 shows the number of handguns seized from organized crime group members and from persons other than organized crime group members over the last 5 years. In 2002, the total number of handguns seized was 747, among which real handguns came to 675, accounting for 90.4%. It was notable that in 2002 the number of handguns seized from persons other than organized crime group members (420) was larger than that seized from those group members (327).
If examined countries of gun production, among the 675 real handguns seized in 2002, the U.S.A. produced the largest share with 191, followed by China with 42, Russia with 36, Belgium with 35, and the Philippines with 33 (Source: Data by Community Safety Bureau, National Police Agency). Fig. 1-1-8-3 Trends in the number of seized handguns (1998-2002) |