| Previous Next Index Image Index Year Selection | |
|
|
1 Outline The principal data concerning penal code offenses in 2002 are as follows. General penal code offenses refer to penal code offenses excluding professional negligence in traffic accidents.
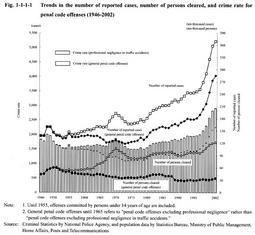
Principal data for 2002 (penal code offenses) (year-on-year change) [1] Number of reported cases Penal code offenses 3,693,928 (+112,407) (+3.1%) General penal code offenses 2,854,061 (+118,449) (+43%) General penal code offenses excluding larceny 476,573 (+81,472) (+20.6%) [2] Number of cleared cases Penal code offenses 1,432,548 (+44,524) (+3.2%) General penal code offenses 592,681 (+50,566) (+93%) General penal code offenses excluding larceny 188,809 (+14,337) (+8.2%) [3] Number of persons cleared Penal code offenses 1,219,564 (+23,667) (+2,0%) General penal code offenses 347,880 (+22,588) (+6.9%) General penal code offenses excluding larceny 167,155 (+10,782) (+6.9%) [4] Crime rate Penal code offenses 2,899 (+85) General penal code offenses 2,240 (+91) General penal code offenses excluding larceny 374 (+64) [5] Clearance rate Penal code offenses 38.8 (+0.03 points) General penal code offenses 20.8 (+0.9 points) General penal code offenses excluding larceny 39.6 (-4.5 points) (Source: Criminal Statistics by National Police Agency) * "Crime rate" means the number of reported cases per 100,000 persons. Fig. 1-1-1-1 shows the trends in the number of reported cases number of persons cleared , and crime rates for penal code offenses and general penal code offenses since 1946(see Appendix 1-1 ). Fig. 1-1-1-1 Trends in the number of reported cases, number of persons cleared, and crime rate for penal code offenses (1946-2002) (1) Number of reported cases and crime rate The number of reported penal code offenses temporarily declined after peaking in 1970 and then turned up in 1975. It has rapidly risen since 1996, registering a new postwar high every year for 7 years since that year, and reaching 3,693,928 in 2002. The peak in 1970 was mainly due to the increase of professional negligence in traffic accidents while the increase in recent years was mainly due to the rapid rise in general penal code offenses. The crime rate for penal code offenses has shown almost the same trend, reaching a postwar high of 2,899 in 2002.
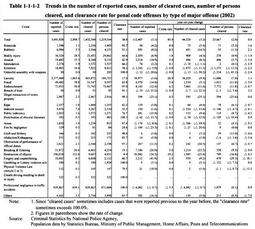
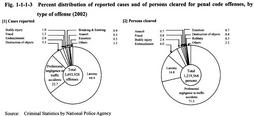
Table 1-1-1-2 and Fig. 1-1-1-3[1] show the number of reported cases of penal code offenses in 2002, by type or offense, in which the number for larceny is the largest, followed by professional negligence in traffic accidents, destruction of objects, embezzlement (including misappropriation of lost property), fraud, and, and bodily injury, etc. Table 1-1-1-2 Trends in the number of reported cases, number of cleared cases, number of persons cleared, and clearance rate for penal code offenses by type of major offense (2002) Fig. 1-1-1-3 Percent distribution of reported cases and of persons cleared for penal code offenses, by type of offense (2002) (2) Number of persons cleared The number of persons cleared for penal code offenses has been generally on the rise since 1992. In 2002, it reached 1,219,564 after having registered a new postwar high every year for 4 years. Table 1-1-1-2 and Fig. 1-1-1-3[2] show the number of persons cleared in 2002, by type of offense, in which the number for professional negligence in traffic accidents is the largest, followed by larceny, embezzlement (including misappropriation of lost property), bodily injury, and fraud, etc.
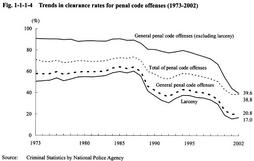
(3) Clearance rate Fig. 1-1-1-4 shows the trends in the clearance rates for penal code offenses, general penal code offenses, larceny, and general penal code offenses excluding larceny over the last 30 years.
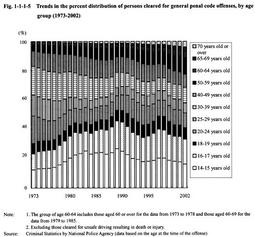
Fig. 1-1-1-4 Trends in clearance rates for penal code offenses (1973-2002) (4) Percent distribution of persons cleared by age group Fig. 1-1-1-5 shows the trends in the percent distribution of persons cleared for general penal code offenses over the last 30 years, by age group. It indicates a characteristic tendency that the share of those aged 60 or over has increased from 2.4% in 1973 to 11.0% in 2002 due to the aging of the population.
Fig. 1-1-1-5 Trends in the percent distribution of persons cleared for general penal code offenses, by age group (1973-2002) |