| Previous Next Index Image Index Year Selection | |
|
|
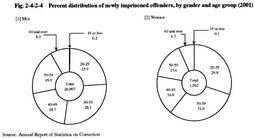
3 Characteristics of newly imprisoned offenders (1) Age Fig. 2-4-2-4 shows the percent distribution of newly imprisoned offenders in 2001 by gender and age group.
Fig. 2-4-2-4 Percent distribution of newly imprisoned offenders, by gender and age group (2001) Among inmates as of December 31, 2001, 5,216 were 60 years of age or over (876 were 70 years or older), accounting for 9.8% of all inmates. (2) Type of offense Of offenses committed by those newly imprisoned in 2001, the following 5 offenses had high percentages for male inmates: (1) larceny (26.8%); (2) Stimulant Drug Control Law violation (24.4%); (3) Fraud (7.0%); (4) Road Traffic Law violation (6.7%); and (5) bodily injury (5.9%). The following 5 offenses had high percentages for female inmates: (1) Stimulant Drug Control Law violation (46.4%); (2) larceny (20.9%): (3) Fraud (8.2%); (4) homicide (4.7%); and (5) Road Traffic Law violation (2.9%) (see Appendix 2-7 ).
(3) Type of sentence and term of imprisonment By type of sentence given to those newly imprisoned in 2001, 99.1% (28,226 inmates) were sentenced to imprisonment with labor, followed by imprisonment without labor (0.7%, 194 inmates), penal detention (0.2%, 47 inmates) and death penalty (executed) (0.01%, 2 inmates).
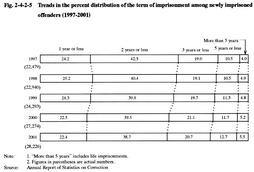
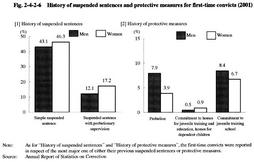
Fig. 2-4-2-5 shows the percent distribution of newly imprisoned offenders sentenced to imprisonment with labor, during the period from 1997 to 2001 by the term of imprisonment, which indicates that the percentage of inmates sentenced to imprisonment for more than 2 years has been gradually increasing. For the trend in the number of inmates serving sentence of imprisonment with labor at the end of 2001 by term of imprisonment, see Appendix 2-11 . Fig. 2-4-2-5 Trends in the percent distribution of the term of imprisonment among newly imprisoned offenders (1997-2001) (4) History of suspended sentences and protective measures for first-time convicts Fig. 2-4-2-6 shows a breakdown of the 14,294 first-time convicts (persons imprisoned to penal institutions for the first time under final judgments) who were newly imprisoned in 2001, according to their histories of suspended sentences and protective measures.
Fig. 2-4-2-6 History of suspended sentences and protective measures for first-time convicts (2001) (5) Frequency of imprisonment Of all offenders newly imprisoned in 2001, repeat convicts (persons who have previously been imprisoned to penal institutions once or more) accounted for 51.0% for males and 28.6% for females. By type of offense, repeat convicts most frequently committed larceny for males (30.7%) and Stimulant Drug Control Law violations for females (57.5%). The number of new inmates who had previously been imprisoned to penal institutions 4 times or more was 5,488 accounting for 19.3 % of the total, and such new inmates accounted for 41.5% of those imprisoned for Physical Violence Law violations and 33.3% of those imprisoned for breaking and entering (see Appendix 2-8 and 2-9 ).
|