| Previous Next Index Image Index Year Selection | |
|
|
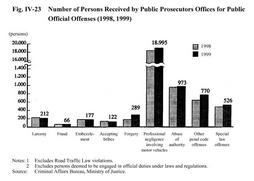
1 Overview Fig. IV-23 shows the number of persons received by public prosecutors offices for public official offenses in1998and1999,by category of offense. The number received in1999rose by1,218(5.8%)from the previous year to22,130. By offense, death or bodily injury caused by professional negligence involving a motor vehicle accounted for an overwhelming majority(85.8%of the total), followed by abuse of authority and forgery.
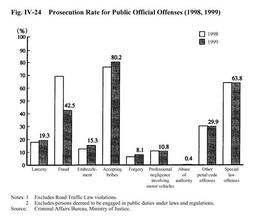
Fig. IV-23 Number of Persons Received by Public Prosecutors Offices for Public Official Offenses(1998,1999) Fig. IV-24 shows the prosecution rate for public official offenses in1998and1999,by category of offense. In1999the rate was highest for accepting bribes, followed by fraud and larceny. Fig. IV-24 Prosecution Rate for Public Official Offenses(1998,1999) |