| Previous Next Index Image Index Year Selection | |
|
|
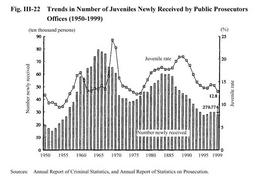
1 Prosecution in juvenile cases Fig. III-22 shows the number of juvenile offenders newly received by public prosecutors offices and the ratio of juveniles to the total number of persons received by public prosecutors offices(the juvenile rate)since 1950.
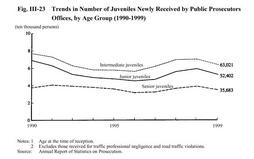
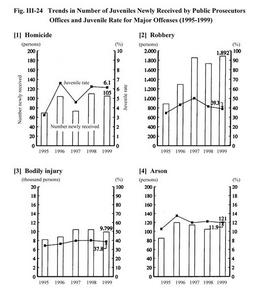
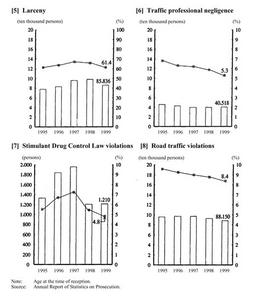
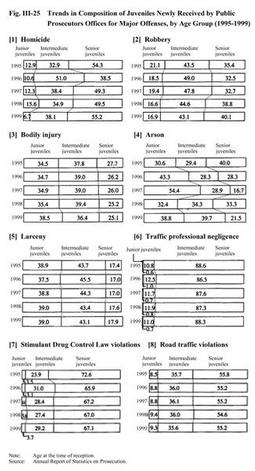
After reaching a record high of793,318in1965,the number of juveniles newly received declined until1975,when it turned up to hit the next peak at601,572in1983. Subsequently, it continued to decline until1995,only to resume its upward movement in1996. In1999,however, the number of juveniles newly received declined by18,835from the previous year to279,774. As a consequence, the juvenile rate also dropped to12.8%as compared with14.2%in the previous year.184,087of those juveniles were received for penal code offenses(with a juvenile rate of17.8%), and95,687juveniles were received for special law offenses(8.3%). Juveniles received for penal code offenses other than traffic professional negligence amounted to143,569(52.9%), and those received for special law offenses other than road traffic violations totaled7,537(8.2%). Fig. III-22 Trends in Number of Juveniles Newly Received by Public Prosecutors Offices(1950-1999) Fig. III-23 Trends in Number of Juveniles Newly Received by Public Prosecutors Offices, by Age Group(1990-1999) The number received and the juvenile rate for homicide have both fluctuated repeatedly. As for robbery, the number received has shown a considerable upward trend while the juvenile rate has remained in the30%-40%range, with the exception of1997,when it exceeded50%. For bodily injury, the number received and the juvenile rate both continued to increase, only to decline in1999from the previous year. The number received and the juvenile rate for arson have both stayed generally on a par. Concerning larceny, the number received and the juvenile rate both showed an upward trend until1999,when they declined from the previous year. As regards traffic professional negligence, the number received continued to decrease but turned upward in1999from the previous year, while the juvenile rate has continued to decline. The number received and the juvenile rate for Stimulant Drug Control Law violations both rose substantially until1997,but have been in a downward trend ever since. As for road traffic violaltions, the number received increased until1997,when it turned downwards, whereas the juvenile rate has declined constantly. Fig. III-24 Trends in Number of Juveniles Newly Received by Public Prosecutors Offices and Juvenile Rate for Major Offenses(1995-1999) Senior juveniles have accounted for some 50% of juveniles received for homicide, with the exception of 1996. As for robbery, intermediate juveniles have constantly had a larger share than other age groups, staying in the 40% range. The ratio of senior juveniles in the total number received for bodily injury has constantly declined while that of junior juveniles has continued to rise, in 1999 surpassing the ratio of intermediate juveniles, which had been highest among the age groups. For arson, the ratio of intermediate juveniles has been on an upward trend, while that of junior and senior juveniles has repeatedly fluctuated. Intermediate juveniles have constantly accounted for the largest part of the juveniles received for larceny, followed by junior juveniles and senior juveniles, in that order. As for traffic professional negligence and road traffic violations, the ratio was higher for older age groups. This tendency was particularly significant for traffic professional negligence. A similar trend can be observed for Stimulant Drug Law violations. Fig. III-25 Trends in Composition of Juveniles Newly Received by Public Prosecutors Offices for Major Offenses, by Age Group(1995-1999) As regards cases transferred(or referred back)to public prosecutors by family courts, 97.6% of the 8,230 juveniles prosecuted by public prosecutors offices in 1999 involved traffic professional negligence or road traffic violations. Only 3.6% of those juveniles were prosecuted for formal trial(46.2% of penal code offenders and 0.9% of special law offenders). Prosecution for summary proceedings were applied for other cases(see Appendix III-10 ). |