| Previous Next Index Image Index Year Selection | |
|
|
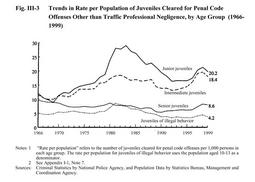
2. Trends by age group Fig. III-3 indicates the number of juveniles cleared for penal code offenses other than traffic professional negligence per 1,000 persons by age group since 1966 (see Appendix III-2 ).
As regards junior juveniles, the number continued to increase from 9.1 in 1969(30,892 persons cleared) to a record high of 29.5 in 1983(110,433 persons cleared). This movement roughly corresponds to the aforementioned third wave of juvenile delinquency, characterized by an increase in delinquency by junior juveniles, that is, earlier initiation of delinquency. The number showed a downward trend from 1984, only to resume its upward movement in 1996. Although it fell slightly in 1999 to 20.2 (59,252 persons cleared), junior juveniles still had a higher ratio of persons cleared than any other age group. Fig. III-3 Trends in Rate per Population of Juveniles Cleared for Penal Code Offenses Other than Traffic Professional Negligence, by Age Group (1966-1999) As for senior juveniles, the rate per population has stayed on a par or shown a slight downward trend in general since 1966, when it stood at 9.7 (45,900 persons cleared), albeit with some fluctuations. Thus, the number did not change significantly even in the early 1980s, when the rate per population rose substantially for junior and intermediate juveniles. After showing a slight upward trend from 1996, it fell again in 1999 to 8.6 (26,840 persons cleared). Looking at the trend for juveniles of illegal behavior, the rate per population stayed largely on a par from 1966, followed by an upward trend in the early 1980s, peaking at 8.9 (67,906 persons cleared) in 1981. Subsequently, the number stayed in a downward trend in general despite a slight upward trend observed from1996. In 1999, it fell from the previous year to 4.2 (22,503 persons cleared). |